Retail Tracker

Retail Tracker Report
Period ending 10/06/2024
Produced every four weeks, the Retail Tracker Report provides insight into category dollar sales, segment and variety sales, average price per pound, and other helpful metrics.
A few of the key findings of the report for the weeks ending October 6, 2024 are:
- The marketplace was heavily disrupted late September, early October as consumers stocked up on food and basics in advance of the eastern seaboard port strikes and hurricanes Helene and Milton in the Southeast.
- Mushroom dollar sales reached $111 million in the quad-week period, mostly unchanged from the same four weeks last year.
- Specialty mushrooms had a very strong quad-week performance, up 23.4% in dollars.
- The quad-week’s volume sales increased over the prior quad weeks, as predicted. Volume typically gains between now and mid-January.
- Mushroom prices increased slightly, at +1.3% on a price-per-pound basis.
Download your copy of the quick two-page summary,
the plug-and-play PowerPoint ready for use, and the in-depth Excel data file.


Source: Circana, Integrated Fresh, MULO, 4 or 52 weeks ending 10/06/2024
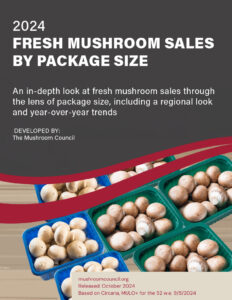
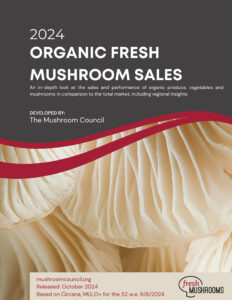
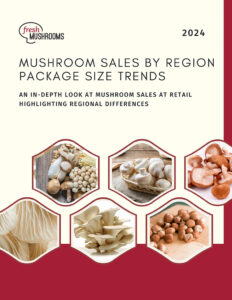
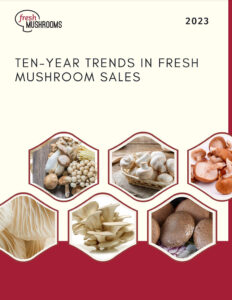
Retail Market Trend Papers

Recent Tracker Archive
2024
January 2024
February 2024
March 2024
April 2024
May 2024
June 2024
July 2024
August 2024
September 2024
October 2024
November 2024
December 2024
2023
January 2023
January 2023
February 2023
March 2023
April 2023
June 2023
July 2023
August 2023
September 2023
October 2023
November 2023
December 2023
December 2023 – Year End
2022
January 2022
February 2022
March 2022
April 2022
June 2022
July 2022
August 2022
September 2022
October 2022
December 2022
Tracker Archive
2021
- 2021 Fresh Mushroom Year in Review DOC
- Mushroom Performance 2021 Year-End PPT
- Period Ending 12/26/2021
- Period Ending 11/28/2021
- Period Ending 10/31/2021
- Period Ending 10/3/2021
- Period Ending 9/5/2021
- Period Ending 8/8/2021
- Period Ending 7/11/2021
- Period Ending 6/13/2021
- Period Ending 5/16/2021
- Period Ending 4/18/2021
- Period Ending 3/21/2021
- Period Ending 2/21/2021
- Period Ending 1/24/2021
2020
- Period Ending 12/27/2020
- Period Ending 11/29/2020
- Period Ending 11/01/2020
- Period Ending 10/04/2020
- Period Ending 09/06/2020
- Period Ending 08/09/2020
- Period Ending 07/12/2020
- Period Ending 06/14/2020
- Period Ending 05/17/2020
- Period Ending 04/19/2020
- Period Ending 03/22/2020
- Period Ending 02/23/2020
- Period Ending 01/26/2020
2019
- Period Ending 12/29/2019
- Period Ending 12/01/2019
- Period Ending 11/03/2019
- Period Ending 10/06/2019
- Period Ending 09/08/2019
- Period Ending 08/11/2019
- Period Ending 07/15/2019
- Period Ending 06/16/2019
- Period Ending 05/19/2019
- Period Ending 04/21/2019
- Period Ending 03/24/2019
- Period Ending 02/24/2019
- Period Ending 01/27/2019
2018
- Period Ending 12/30/2018
- Period Ending 12/2/2018
- Period Ending 11/4/2018
- Period Ending 10/7/2018
- Period Ending 09/9/2018
- Period Ending 08/12/2018
- Period Ending 07/15/2018
- Period Ending 06/17/2018
- Period Ending 05/20/2018
- Period Ending 04/22/2018
- Period Ending 03/25/2018
- Period Ending 02/25/2018
- Period ending 01/28/2018
2017
- Period ending 12/31/2017
- Period ending 12/03/2017
- Period ending 11/05/2017
- Period ending 10/08/2017
- Period Ending 09/10/2017
- Period Ending 08/13/2017
- Period Ending 07/09/2017
- Period Ending 06/11/2017
- Period Ending 05/14/2017
- Period Ending 04/16/2017
- Period Ending 03/19/2017
- Period Ending 02/19/2017
- Period Ending 01/22/2017
2016
- Period Ending 12/25/2016
- Period Ending 11/27/2016
- Period Ending 10/30/2016
- Period Ending 10/2/2016
- Period Ending 9/4/2016
- Period Ending 8/7/2016
- Period Ending 7/10/2016
- Period Ending 6/12/2016
- Period Ending 5/15/2016
- Period Ending 4/17/2016
- Period Ending 3/20/2016
- Period Ending 2/21/2016
- Period Ending 1/24/2016
2015
- Period Ending 12/27/2015
- Period Ending 11/1/2015
- Period Ending 10/4/2015
- Period Ending 11/29/2015
- Period Ending 9/6/2015
- Period Ending 8/9/2015
- Period Ending 7/12/2015
- Period Ending 6/14/2015
- Period Ending 5/17/2015
- Period Ending 4/19/2015
- Period Ending 3/22/2015
- Period Ending 2/22/2015
- Period Ending 1/25/2015
2014
- Period Ending 12/28/2014
- Period Ending 11/30/2014
- Period Ending 11/2/2014
- Period Ending 10/5/2014
- Period Ending 9/17/2014
- Period Ending 8/10/2014
- Period Ending 7/13/2014
- Period Ending 6/15/2014
- Period Ending 5/18/2014
- Period Ending 4/20/2014
- Period Ending 3/23/2014
- Period Ending 2/23/2014
- Period Ending 1/26/2014
2013
- Period Ending 12/29/2013
- Period Ending 12/1/2013
- Period Ending 11/3/2013
- Period Ending 10/6/2013
- Period Ending 9/8/2013
- Period Ending 8/11/2013
- Period Ending 7/14/2013
- Period Ending 6/16/2013
- Period Ending 5/19/2013
- Period Ending 4/21/2013
- Period Ending 3/24/2013
- Period Ending 2/24/2013
- Period Ending 1/27/2013
Press Releases
Find our past and present press releases distributed by the Mushroom Council.
AMI Resources
The American Mushroom Institute (AMI) is a trade association representing the growers, processors and marketers of mushrooms in the United States. Find resources on growing, health and safety, regulatory issues and much more on their website.

