 Shipping Reports
Monthly Shipping and Marketing Report | July 2022
Council Update
***SAVE THE DATE***
Annual Industry Meeting – Wednesday, September 7 in Kennett Square, PA
Open Positions on the Council (2023-2025 term):
Ballots are in and the nominees are completing background forms and the Council is gathering information to send to the Secretary of Agriculture for appointments.
- Region 1 (All states except CA & PA) – two open positions (3-year terms)
- Region 2 (PA) – one open position (3-year term)
- Region 4 (Imports) – one open position for a 1+ year term
Thank you to all who participated in the nominations and voting!
Next Council meeting – September 8, 2022, in Kennett Square, PA
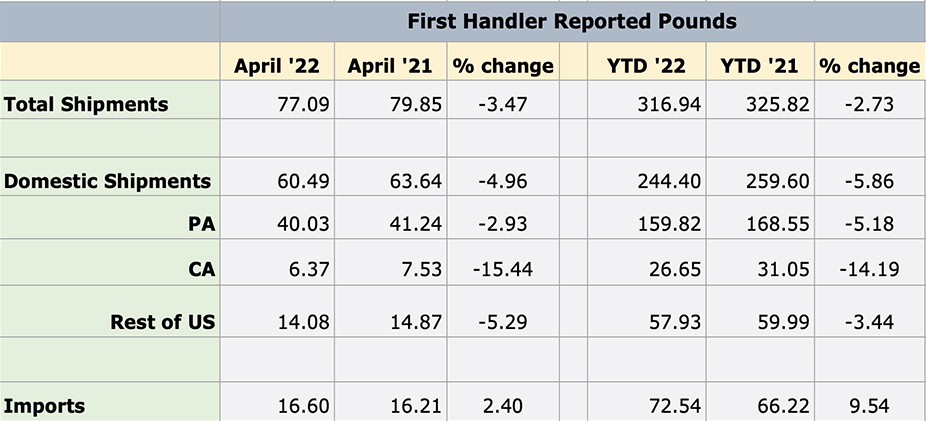
Shipment Summary
To see current charts, click here.
The Month Ahead
SCHOOL NUTRITION
- In July, Mushrooms in Schools will be exhibiting at the 2022 Annual Nutrition Conference (ANC). Additionally, we will be highlighting portabella mushrooms on our blog as well as highlighting notable holidays throughout the month. This will include activities on social media. We encourage other channels to amplify Mushrooms in Schools by sharing our posts on Facebook and Twitter.
Highlights from June
SCHOOL NUTRITION
- We amplified mushroom facts for Summer Food Service Program sponsors and culinary training for back to school trainings on social media. Additionally, Mushrooms in Schools amplified the Blended Burger Contest.
Sales Materials
SCHOOL NUTRITION
- Mushrooms in Schools is exhibiting at the 2022 School Nutrition Association’s Annual Nutrition Conference in Orlando, Florida during July 10-12. If you are interested in attending please register here or contact Malissa Marsden to discuss your involvement.
Metrics
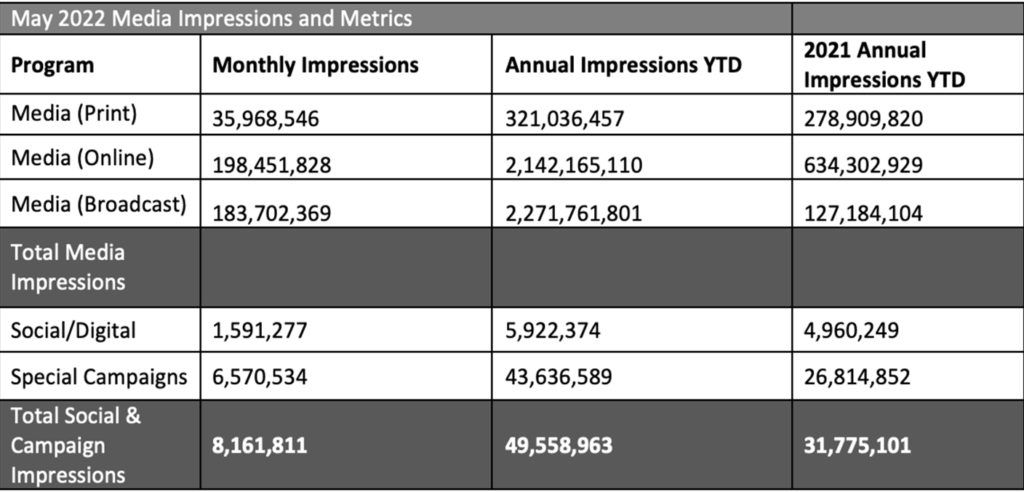
Notable Impressions Highlights:
- May: National Burger Month – Mushroom Council kicked of it’s Food Network promotions and Blended Burger Contest in May. While we are still waiting on reporting from Food Network for May activities, we did see some notable highlights:
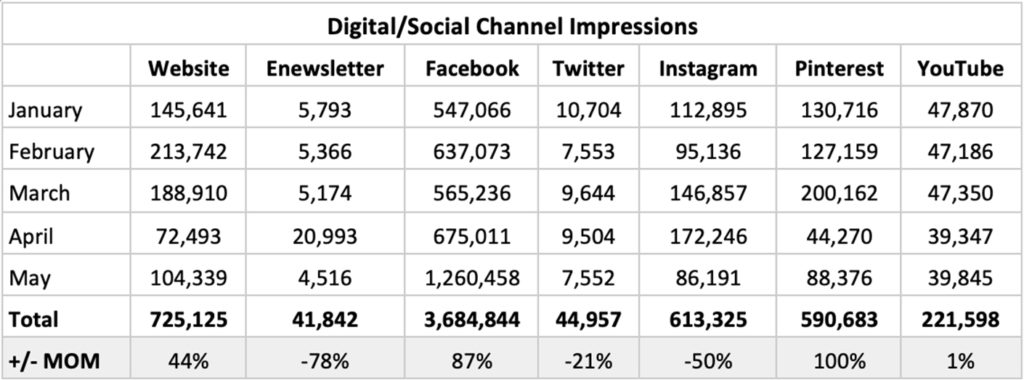
- Facebook Impressions increased by nearly 90% due to the increase in paid support and promotions for the Blended Burger Contest.
- Pinterest Impressions doubled (+100%) from April due to increased burger pins and added spend.
- Website traffic increased (+44%) due to promotions pointing to the Blended Burger Contest page on MC.com, with the page itself accounting for 25% of all pageviews from May.
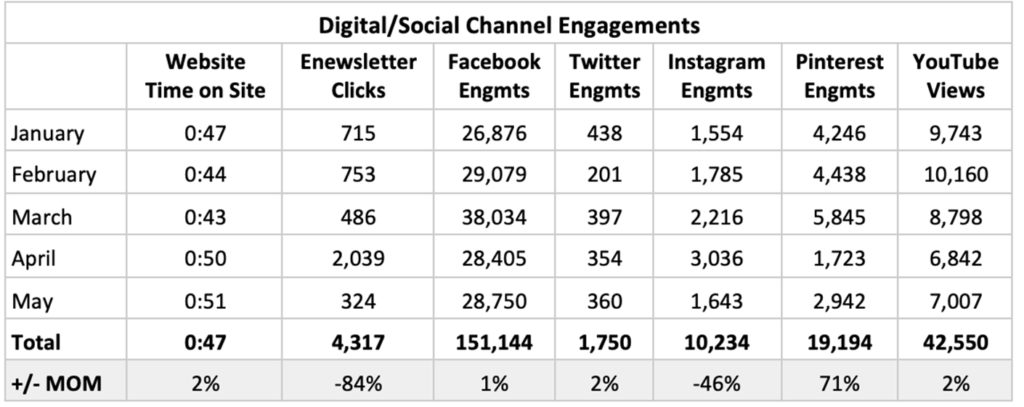
- The Enewsletter saw a dramatic decrease in Opens and Clicks. This is due to scaling back to our cadence of 1x/month communications. In April, we sent out weekly eblasts promoting our Kittch chefs, which dramatically increased Total Opens/Clicks.
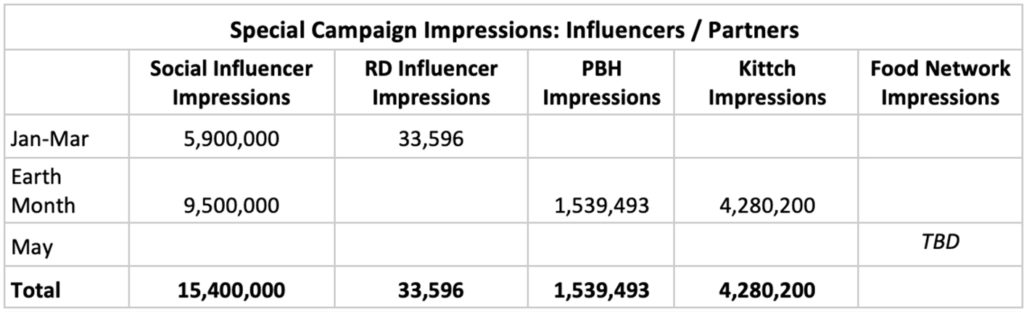
Special Campaign Impressions
Includes paid promotions, partnerships and advertising activities.
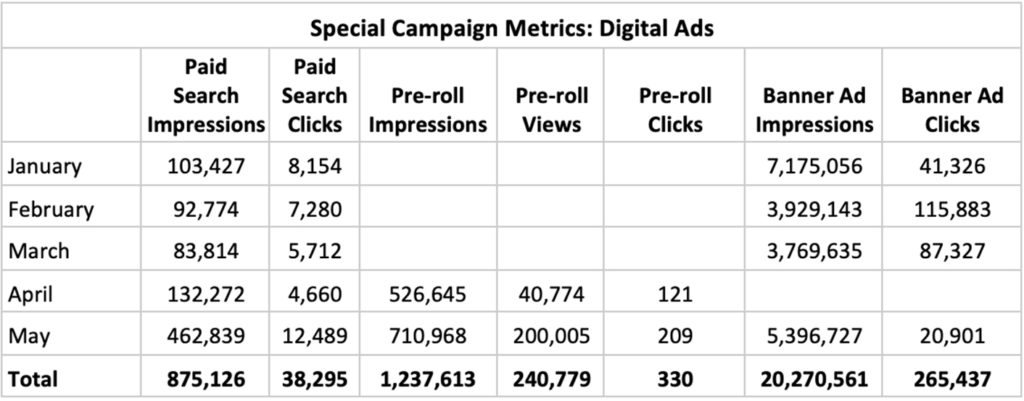
- January: Feed Your Immune System – The revamped “Feed Your Immune System” campaign kicked off in January, leading to an increase in social impressions across nearly all channels.New digital banner ads in January contributed to 7M impressions – helping to surpass January 2021 impressions.
- Influencer impressions decreased from 2021 with a stronger focus on engagements (views, clicks) as video becomes a primary way to reach audiences with our messages.Noteably: Engagements nearly doubled and clicks to site more than tripled.
- Instagram Reels and new animations helped to increase Instagram impressions by nearly 200%, while the website also saw a dramatic increase in pageviews due to the campaign landing page traffic.
- The FeedYourImmuneSystem.com landing page received nearly 60k pageviews in January – a 411% increase from January 2021.
- February: Feed Your Immune System – February saw continued success for the FYIS campaign as numbers built and surpassed January metrics, especially on the website:
- The FeedYourImmuneSystem.com landing page received more than 150k pageviews in February – a 156% increase from January and 400% increase from ALL of Q1 2021 (1346% compared to February 2021).
- Avg. time on page stayed around 5 minute (4:59) – still surpassing the site average of 2-3 minutes.
- A majority of the traffic came from the FYIS banners ads (115,883 clicks to page from these ads). While we saw higher impressions for the banner ads in January, we changed bidding strategies to ensure we are reaching an engaged audience – which by evidence of clicks, we are.
- The FeedYourImmuneSystem.com landing page received more than 150k pageviews in February – a 156% increase from January and 400% increase from ALL of Q1 2021 (1346% compared to February 2021).
- March: Feed Your Immune System – The Q1 campaign wrapped up in March with results that outpaced 2021’s award-winning campaign. Most notably:
- The FeedYourImmuneSystem.com landing page received more than 10x the pageviews compared to 2021.
- The Banner Ads (new in 2022) were instrumental in getting eyes and traffic to the landing page – contributing to more than 240,000 clicks to site and 61% of all Social/Digital Impressions in 2022.
- The drop in impressions throughout the quarter was due to bidding strategies changing to target more audiences that would click.
- April: Earth Month – Mushroom Council kicked off Earth Month with the “Mushrooms – The Official Ingredient of Earth Month” campaign, which resulted in our most successful campaign to date this year (measured by impressions and engagements).
- The vast majority of impressions (90%) were the result of our Earth Month partnerships: Kittch (4.2M), Social Influencers (9.5M) and Produce for Better Health (1.6M).
- During April, we increased consumer elbasts to weekly, resulting in a 300% increase in opens and clicks.
- Website impressions (pageviews) saw a decrease due to the majority of MC promotions pointing users to the Mushroom Council Kittch channel to watch the daily streams (vs. pointing to our own site).
- Instagram Reels sharing chef stream “cut downs” (created in partnership with Kittch) helped to increase Instagram impressions (+17%) and engagement (+37%).
Monthly Topline Report
Tracker Highlights – Period ending 06/12/2022
- Download Retail Tracker for Period ending 06/12/2022
- Download Fresh Mushroom Sales Review for Period ending 06/12/2022
- Download Mushroom Retail Performance for Period ending 06/12/2022
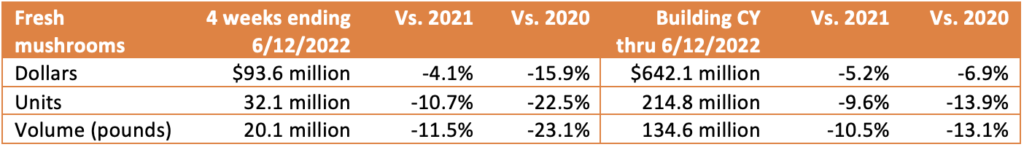
Dollars, Units and Volume Performance
- Inflation dominated the media headlines in the past four weeks with the price per unit across all food and beverages up 12.5% versus the same four weeks in 2021 and 23.6% versus 2019. Shoppers are hyper aware of the increases in cost and 76% are making changes to their grocery shopping. Dollar sales trended in the positive for most departments, boosted by high inflation. However, volume sales for departments around the store took a significant dip from their already down levels in the prior quad weeks. Fresh produce was no exception.
- During the four weeks ending June 12, 2022 versus the same period in 2021, the produce department sales reached $6.2 billion during the four-week period, which was up 2.7%. As such, fresh produce dollar gains are decelerating; units were down 6.0%; and volume sales (pounds) were down 4.7% year-on-year. Additionally, pounds dropped below 2019 levels by 0.2%.
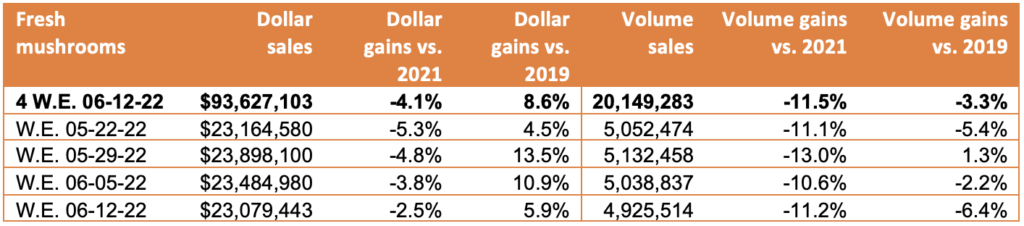
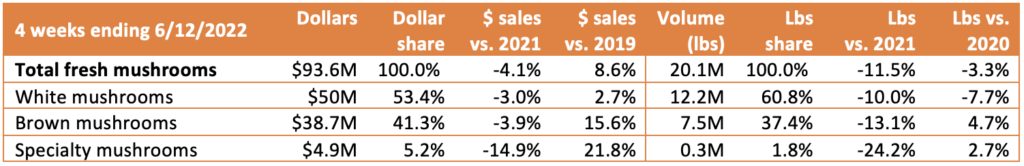
- For the four weeks ending June 12, 2022, fresh mushroom dollars decreased 4.1% year-over year and volume declined by 11.5%. Much like total produce, fresh mushroom pound sales have been decelerating. Year-to-date, volume sales are even with 2019, but for the quad-week period ending June 12th, pounds were down 3.3%.
- Dollar sales during each of the individual weeks averaged $23M to $24 million. In comparison to last year, dollars moved a little closer to the 2021 levels each week. In pounds, the individual weeks hovered around 5 million pounds each week, though dipped slightly below the 5 million pound mark in the week ending June 12th. In comparison to 2019, two weeks trended ahead and two fell behind, for the average decline of 3.3% year-on-year for the quad-week period.
Inflation
- The total produce performance was heavily impacted by inflation in the quad week and year-to-date views. Total produce prices increased to $2.64, up 9.2% during the four weeks ending June 12th on a per unit basis. Vegetables increased to an average of $2.22 per unit, up 10.2% versus year ago in the four-week period. The increases in the price per unit for mushrooms during this same time period remained below the total vegetable average, at +7.4%. At the same time, at $2.91, the average ring for mushrooms is higher than that of many other vegetable categories.
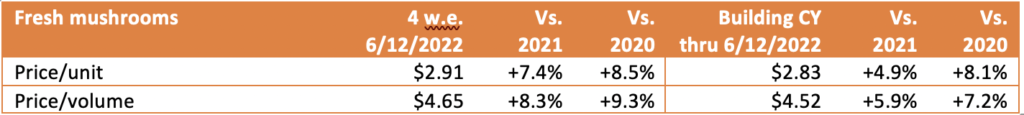
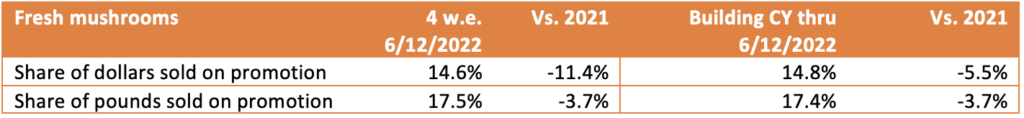
- Fresh mushroom dollar and pounds were promoted less often. Less than 15% of dollars were promoted, down 11.4% from year ago when merchandising levels were down as well. In comparison, 31.8% of fresh produce dollars were generated by items on promotion, with a slight increase versus year ago.
Performance by segment
- Up from 51.8% in the prior quad-week period, white mushrooms represented 53.4% of total fresh mushroom dollars. Year-on-year, white mushrooms were down the least, at -3.0% and specialty was down the most, at -14.9%. White mushrooms’ volume share was higher, at 60.8%, also up from the prior period when it was 58.7% of pounds. It was brown mushrooms, the combination of criminis and portabellas, that fared better in volume. In fact, both specialty and brown mushrooms still sold more pounds than during the same weeks in 2019, at +4.7% and +2.7%, respectively.
Additional observations:
- Fixed versus random weight performance: Fixed weight represented 94.9% of dollars and 95.7% of volume in the quad-week period. Fixed weight also had the better dollar, unit and volume performance. While fixed weight was down 5.6% in the four-week period, random weight (loose/bulk) was down 15.4%.
- Organic versus conventional: Organic dollar sales made up 12.7% of total fresh mushroom sales in the four weeks. Organic mushrooms dollars increased year-on-year (+1.7%), but units and pounds were down.
- Cut/prepared versus whole mushrooms: Cut or prepared mushrooms made up 53.3% of dollar sales in the four-week period. Mushrooms without preparation had the better performance, down -4.0% year-on-year versus -7.9% for cut/value-added mushrooms.
IRI, Integrated Fresh, MULO, 52 weeks ending 06/12/2022
We collect, use and process your data according to our Privacy Policy.