 Shipping Reports
Monthly Shipping and Marketing Report | November 2022
Council Update
A call for nominations will be sent out on February 1, 2023
- Region 1 (All states except CA & PA) – one open positions (3-year terms)
- Region 2 (PA) – one open position (3-year term)
- Region 4 (Imports) – one open position (3-year term)
Exemption Applications: The exemption applications for the 2023 calendar year will be mailed to those who are currently exempt. If you do not receive an application and would like to apply for an exemption, please email [email protected] or download an application here.
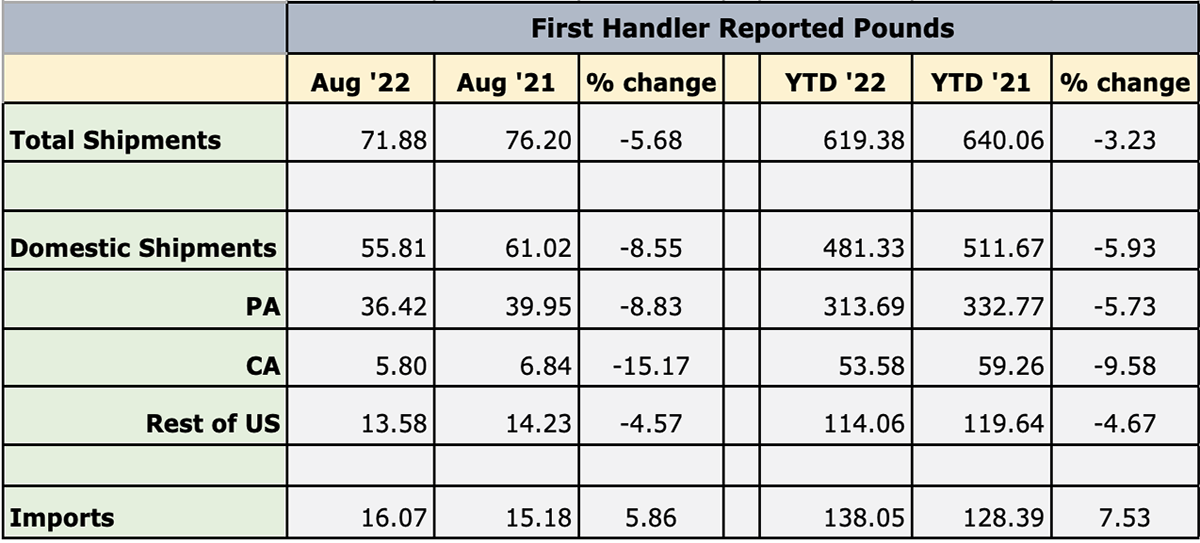
Shipment Summary
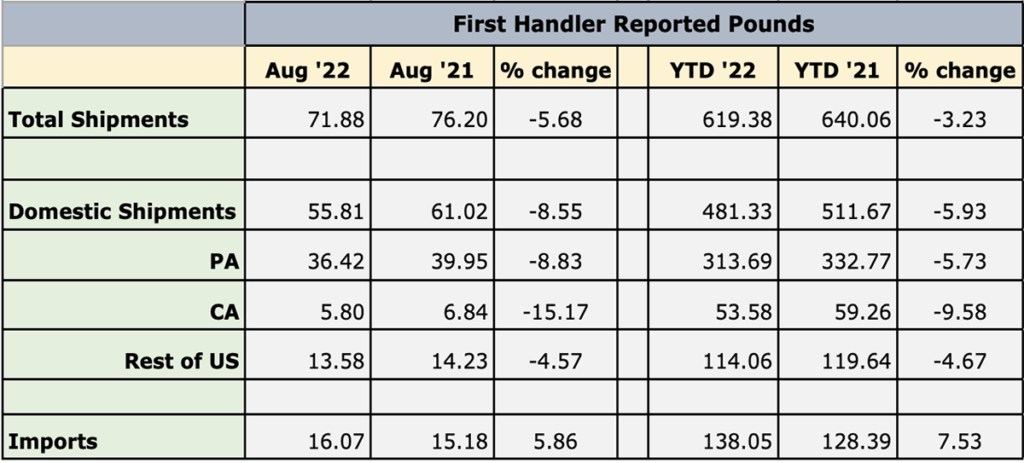
To see current charts, click here.
The Month Ahead
SCHOOL NUTRITION
- In November, Mushrooms in Schools will be discussing food safety for the holidays. We will be amplifying new resources, like Mighty Mushroom in the Kitchen, on food safety for CACFP providers. Additionally, we will be celebrating thankfulness and other resources school districts can use in kitchens. We encourage other channels to amplify Mushrooms in Schools by sharing our posts on Facebook and Twitter.
Highlights from September
SCHOOL NUTRITION
- In October, Mushrooms in Schools celebrated National School Lunch Week (NSLW) and National Mushroom Day. We amplified new resources to celebrate NSLW through social media, blog, and newsletter. Additionally, we highlighted recipes and other resources school districts can use in kitchens. We provided our audience with recipes.
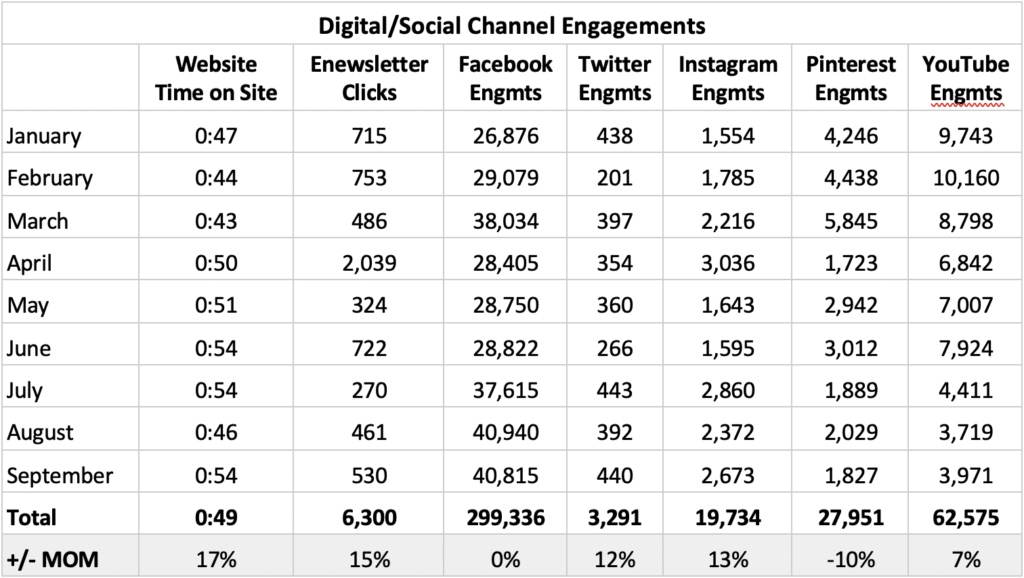
Metrics
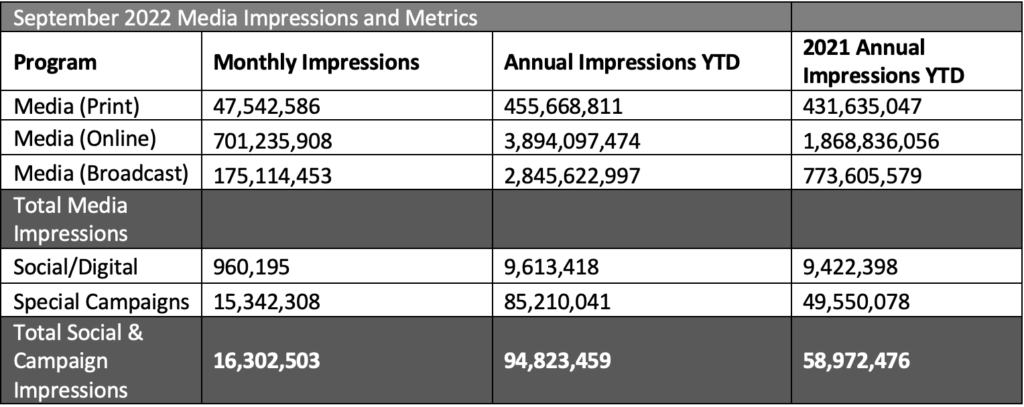
Notable Impressions Highlights:
- September was National Mushroom Month
- Our syndicated article “A Savory Solution to Stretch Your Grocery Budget” continued to perform well, with over 4,000 placements and over 13 million impressions.
- Due to National Mushroom Month, social channels (Facebook, Twitter, Instagram) saw a signifacant increase in impressions and engagement.
- Our site saw a 17% increase in time on site. We attest this to the launch of our National Mushroom Month landing page, featuring robust content on how Mushrooms are the Answer to… and a tote bag sweepstakes.
- We saw a drop in Pinterest engagement (-10%), our team has proactively worked with Pinterest to optimize the recipes with visibility to ingredient lists, timing, and servings now available.
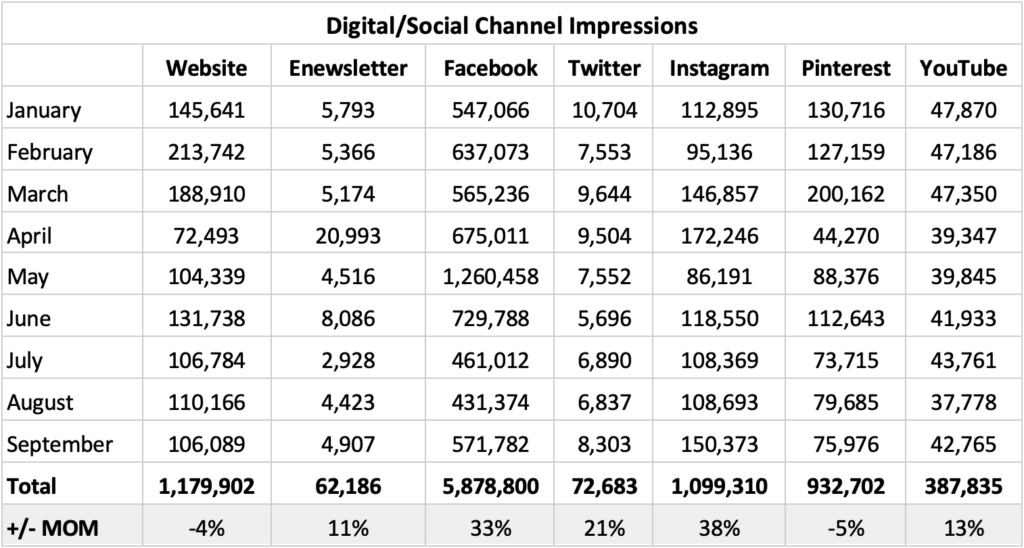
| *Youtube Engagament metrics have changed. Digital metrics are constantly evolving, so we created our own updated Engagement metrics (comments + shares + likes + dislikes + subscribers lost + subscribers gained) |
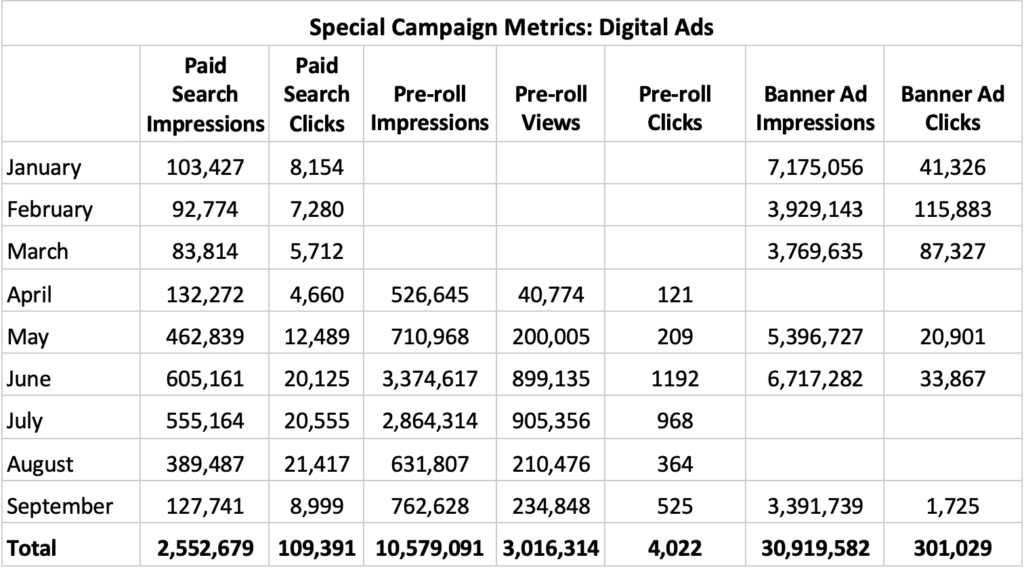
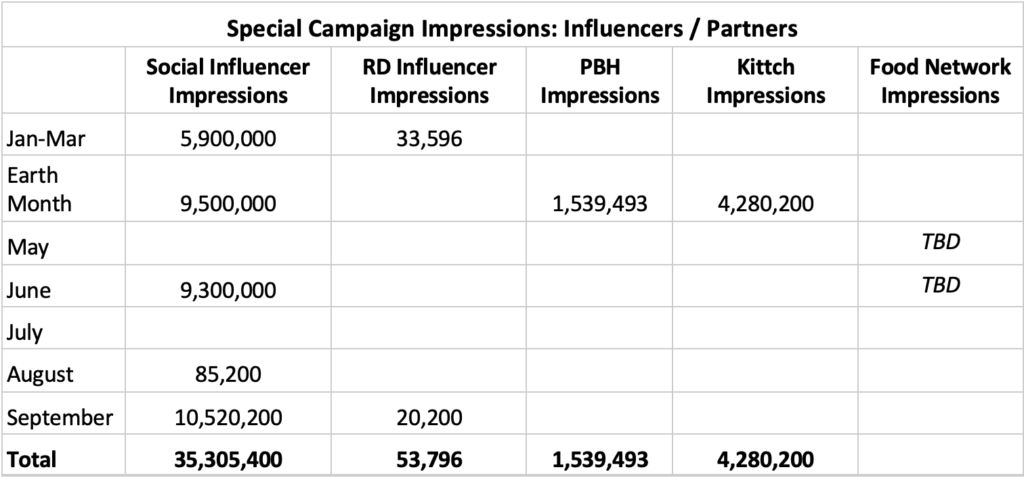
Special Campaign Impressions
Includes paid promotions, partnerships and advertising activities.
Previous Months’ Highlights
- January: Feed Your Immune System – The revamped “Feed Your Immune System” campaign kicked off in January, leading to an increase in social impressions across nearly all channels.New digital banner ads in January contributed to 7M impressions – helping to surpass January 2021 impressions.
- Influencer impressions decreased from 2021 with a stronger focus on engagements (views, clicks) as video becomes a primary way to reach audiences with our messages.Noteably: Engagements nearly doubled and clicks to site more than tripled.
- Instagram Reels and new animations helped to increase Instagram impressions by nearly 200%, while the website also saw a dramatic increase in pageviews due to the campaign landing page traffic.
- The FeedYourImmuneSystem.com landing page received nearly 60k pageviews in January – a 411% increase from January 2021.
- February: Feed Your Immune System – February saw continued success for the FYIS campaign as numbers built and surpassed January metrics, especially on the website:
- The FeedYourImmuneSystem.com landing page received more than 150k pageviews in February – a 156% increase from January and 400% increase from ALL of Q1 2021 (1346% compared to February 2021).
- Avg. time on page stayed around 5 minute (4:59) – still surpassing the site average of 2-3 minutes.
- A majority of the traffic came from the FYIS banners ads (115,883 clicks to page from these ads). While we saw higher impressions for the banner ads in January, we changed bidding strategies to ensure we are reaching an engaged audience – which by evidence of clicks, we are.
- The FeedYourImmuneSystem.com landing page received more than 150k pageviews in February – a 156% increase from January and 400% increase from ALL of Q1 2021 (1346% compared to February 2021).
- March: Feed Your Immune System – The Q1 campaign wrapped up in March with results that outpaced 2021’s award-winning campaign. Most notably:
- The FeedYourImmuneSystem.com landing page received more than 10x the pageviews compared to 2021.
- The Banner Ads (new in 2022) were instrumental in getting eyes and traffic to the landing page – contributing to more than 240,000 clicks to site and 61% of all Social/Digital Impressions in 2022.
- The drop in impressions throughout the quarter was due to bidding strategies changing to target more audiences that would click.
- April: Earth Month – Mushroom Council kicked off Earth Month with the “Mushrooms – The Official Ingredient of Earth Month” campaign, which resulted in our most successful campaign to date this year (measured by impressions and engagements).
- The vast majority of impressions (90%) were the result of our Earth Month partnerships: Kittch (4.2M), Social Influencers (9.5M) and Produce for Better Health (1.6M).
- During April, we increased consumer elbasts to weekly, resulting in a 300% increase in opens and clicks.
- Website impressions (pageviews) saw a decrease due to the majority of MC promotions pointing users to the Mushroom Council Kittch channel to watch the daily streams (vs. pointing to our own site).
- Instagram Reels sharing chef stream “cut downs” (created in partnership with Kittch) helped to increase Instagram impressions (+17%) and engagement (+37%).
- May: National Burger Month – Mushroom Council kicked off its Food Network promotions and Blended Burger Contest in May. While we are still waiting on reporting from Food Network for May activities, we did see some notable highlights:
- Facebook Impressions increased by nearly 90% due to the increase in paid support and promotions for the Blended Burger Contest.
- Pinterest Impressions doubled (+100%) from April due to increased burger pins and added spend.
- Website traffic increased (+44%) due to promotions pointing to the Blended Burger Contest page on MC.com, with the page itself accounting for 25% of all pageviews from May.
- The Enewsletter saw a dramatic decrease in Opens and Clicks. This is due to scaling back to our cadence of 1x/month communications. In April, we sent out weekly eblasts promoting our Kittch chefs, which dramatically increased Total Opens/Clicks.
- June: The Food Network Blended Burger Contest kicked off in May and ran until June 27th. While we are still waiting on reporting from Food Network for May & June activities, we did see some notable highlights:
- Digital Campaign Impressions and Engagement saw a 63% increase from May. We attest this to grilling season, the Blended Burger Contest, and our Clever Influencer partnership.
- Website traffic increased (+26%) from May due to promotions pointing to the Blended Burger Contest page on MC.com. Session duration also saw an increase (0:54), the longest duration YTD.
- The Enewsletter saw a dramatic increase in Opens and Clicks. This is due to our additional email, Blended Burger Contest – “One Week Left” Reminder.
- July: The Food Network Blended Burger Contest ended in June. We kicked off the micro-campaign; value in response to inflation. The messaging for this campaign is centered around mushrooms are essentail, an answer to rising food costs. While this is a micro-campaign, we did see some notable highlights:
- Social Engagement (FB, Twitter, IG) saw a 69% increase from June. Posts about mushroom sustainability, meme/infographic-style posts, and a recipe share from The Kitchn generated the most engagements. July post copy was also shorter and used more emojis than June post copy.
- Website traffic decreased by 19%. We attest this drop due to traffic driving increases from Food Network the prior month.
- Pre-roll Impressions and Views continues to perform well above our monthly average with 2,864,314 Impressions and 905,356 views. We ran 2 ads in July, blended and value content.
- E-newsletter metrics decreased; we sent 1 email in July, 2 emails in June.
- August: In anticipation of Mushroom Month, we released a syndicated article that quickly gained traction, resulting in approximately 12.6M impressions
- Our monthly Enewsletter saw a 51% increase in opens and 71% increase in clicks. We attest this to our catchy subject line “Mushrooms are the Answer” and engaging Value content within the email.
- Due to our Value campaign, website traffic increased (+3%) with a decrease (-15%) time on site. We expected to see a minor dip in numbers compared to the Blended Burger contest months.
- Although we saw a minor decrease in social impressions, we saw an increase in engagement for Twitter and Instagram. Recipe posts were top performing posts.
Topline Report
Tracker Highlights – Period ending 10/02/2022
- Download Retail Tracker for Period ending 10/02/2022
- Download Fresh Mushroom Sales Review for Period ending 10/02/2022
- Download Mushroom Retail Performance for Period ending 10/02/2022
The Marketplace
Life remained home-centric in September with 78% of meal occasions prepared at home. Food and beverage prices rose +14.3% year-on-year and +27.2% versus 2019, the pre-pandemic level — keeping the majority of food dollars at retail, according to the September IRI primary shopper survey.
- 94% of Americans are concerned about inflation and 78% are making changes to their grocery shopping, including what they buy, how much and where.
- Despite the high gas prices, 15% cherry pick specials across retailers and 15% now do some of their shopping at lower-cost retailers. This has resulted in traditional grocery losing share whereas value formats, including supercenters and club, have been gaining ground.
- More people are looking for sales specials (49%) and merchandising levels are starting to pick up a bit.
- Other top measures focus on cutting back on non-essentials and sticking to the budget — pressuring units and volume. Total food and beverage unit sales trailed 2019 by 4.1% in September.
- The sales patterns for the fresh produce department were the same: dollars up, units and volume down year-on-year. Additionally, fresh fruit and vegetables lost share to frozen and canned as consumers emphasized price and shelf-life.
- Potatoes were not only the number one vegetable seller, but also the top growth contributor. Other typical recessionary choices came on strong as well including onions, lettuce and bananas.
- In-person trips remain prevalent, at 85%, with the remainder equally divided between click-and-collect and delivery. Takeout is biggest in restaurant trips, with 54% of consumers having orders meals to go.
Dollars, Units and Volume Performance
The high inflation is driving a bigger gap between dollars and volume for most departments, including produce. Fresh produce sales reached $5.7 billion in September, which was up 3.7% versus last year. However, gains were inflation-driven with units down 4.9% and volume down 5.6% year-on-year. This means fresh produce units are declining less than pounds, which points to people shifting to smaller pack sizes.
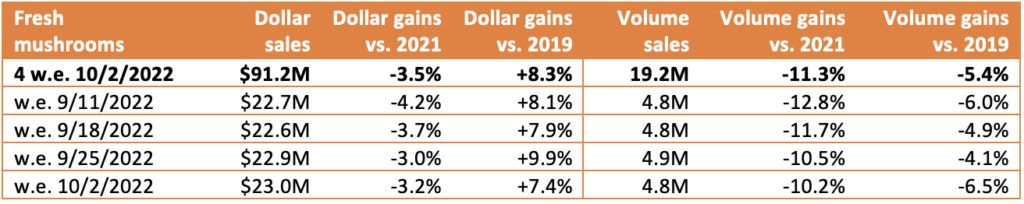
For the four weeks ending October 2nd, 2022, fresh mushroom dollars decreased 3.5% year-over year and volume declined by 11.3%. Year-to-date, dollars were down 4.2% versus year ago and pounds 10.5%.
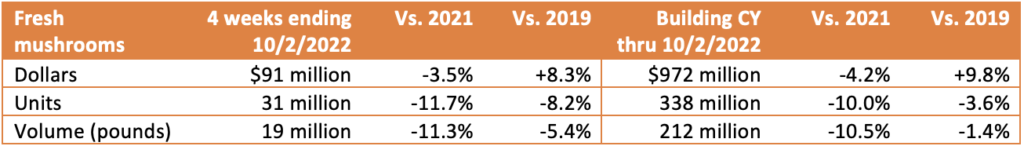
- Weekly sales for mushrooms averaged between $22.6 and $23.0 million, which was an improvement for each when compared to the prior quad week period. Total pounds increased slightly compared to the prior quad-week as well — following prior-year patterns that show an increase in mushroom sales from August through the end of the year (see forecast tab). However, they do remain behind year-ago levels.
Inflation
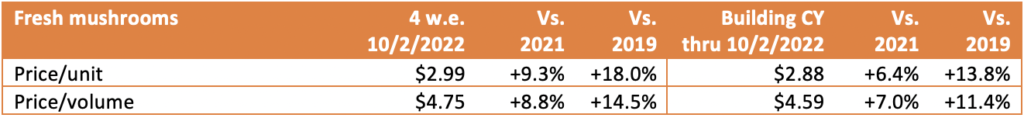
- While mushroom prices per unit increased by 9.3% versus year ago in the latest quad-week period, they continue to track behind the rate of increase for total vegetables (+10.2%) and produce (+8.2%).
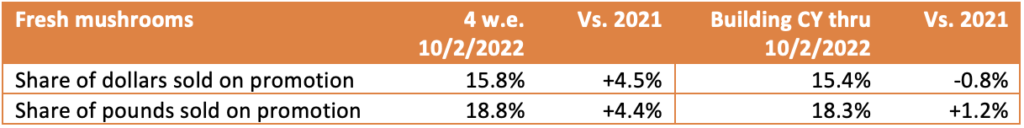
- Despite inflation, promotional activity remained low for fresh mushrooms, at 15.8% of total dollars and 18.8% of total pounds sold. Promotional levels for total fresh produce as well as total food and beverages are also up a bit year-on-year, but still below the 2019 pre-pandemic levels.
Performance by segment
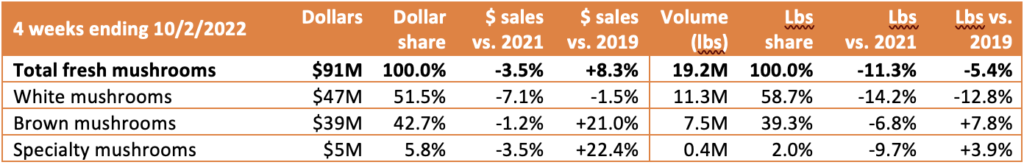
- White mushrooms represented 51.5% of total fresh mushroom sales and 58.7% of pounds in the four-week period. However, it was brown mushrooms, the combination of criminis and portabellas, that fared better with 7.8% pound growth over the 2019 levels, whereas white mushrooms were down 12.8%.
Additional observations:
- Packaged vs. bulk: Pre-packaged represented 95% of pounds and outperformed bulk in dollars/pounds
- Package size: Eight-ounce packages are, by far, the biggest seller and had the best performance of all sizes.
- Organic vs. conventional: Organic mushrooms made up 10.8% of pounds but far outperformed conventional mushrooms in performance in dollars, units and volume.
- Cut/prepared versus whole mushrooms: Cut or prepared mushrooms made up 51.7% of pound sales in the four-week period. Mushrooms without preparation had the better performance.
IRI, Integrated Fresh, MULO, YTD and 4 weeks ending 10/02/2022
We collect, use and process your data according to our Privacy Policy.