 Shipping Reports
Monthly Shipping and Marketing Report | February 2023
Council Update
Open Positions on the Council (2024-2026 term):
A call for nominations will be sent out on February 1, 2023. There are four positions that will be open including:
- Region 1 (All states except CA & PA) – two open positions
- One 2-year term
- One 3-year term
- Region 2 (PA) – one open position (3-year term)
- Region 4 (Imports) – one open position (3-year term)
Council Appointments (2023-2025 term):
The U.S. Department of Agriculture announced the appointment of three members to serve on the Mushroom Council.
Newly appointed members:
- Michael Stephan, Minneapolis, Minnesota – Representing Region 1 – 3-year term (2023-2025)
- Keith Silfee, West Grove, Pennsylvania – Representing Region 2 – 3-year term (2023-2025)
- Kim Marks, Leamington, Ontario, Canada – Representing Region 4 – 1-year term (2023)
2023 Council Members:
Region 1: All states except CA & PA
- Curtis Jurgensmeyer – J-M Farms – OK – 2nd Term
- Michael Stephan – Monterey Mushrooms – MN – 1st Term
Region 2: PA
- Michael Basciani, Sr. – M.D. Basciani Mushrooms – PA – 1st Term
- Joe Caldwell – Giorgi Mushroom Company – PA – 2nd Term
- Meghan Klotzbach – C.P. Yeatman & Sons – PA – 2nd Term
- Keith Silfee – Needham Mushrooms – PA – 1st Term
Region 3: CA
- Jack Guan – California Terra Garden – CA – 1st Term
Region 4: Imports
- Kim Marks – Highline Mushrooms – ON – 1st Term
Exemption Applications: The exemption applications for the 2023 calendar year were mailed to those who are currently exempt. If you did not receive an application and would like to apply for an exemption, please email [email protected] or download an application here. All exemption numbers beginning with 2022 are no longer valid.
Council Meeting: The next Council meeting will be held on February 23 in Charleston, South Carolina.
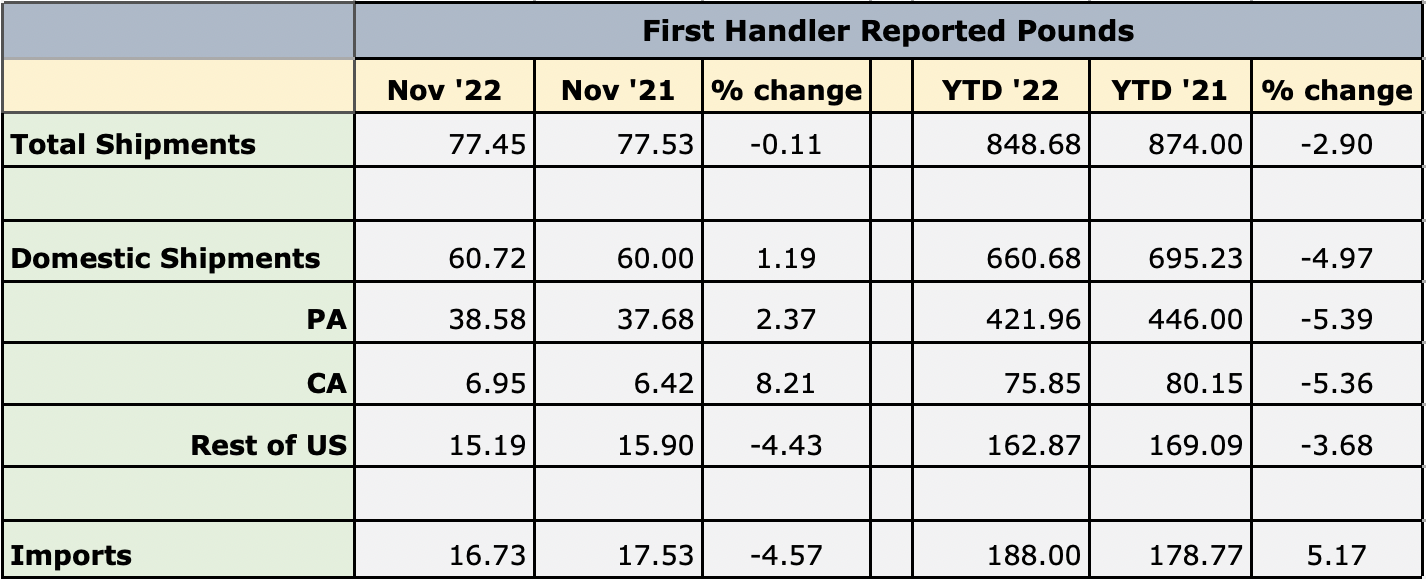
Shipment Summary

To see current charts, click here.
Looking ahead to February
CHILD NUTRITION
- In February, Mushrooms in Schools will be discussing all things pizza! We will provide pizza recipes as well as tips and tricks via our blog, social media, and newsletter. Additionally, we will release our National Nutrition Month resources for March. We encourage other channels to amplify Mushrooms in Schools by sharing our posts on Facebook and Twitter.
NUTRITION RESEARCH
- Continued monitoring research projects of Campbell, Williams and Phillips
- Drafted RFP for behavior research which will be distributed in February
- Will submit comments on FDA revised definition of “healthy” in February
FOODSERVICE
- As interest in protein analogs (meat mimics) continues to fade, The Blend and Mushrooms are the sought-after ingredients for a center of the plate star. A number of LTOs are in the development or testing phase.
Highlights from January
CHILD NUTRITION
- During January, Mushrooms in Schools highlighted culinary skills resources. Additionally, we provided recipes including portabella mushrooms via our blog, social media, and newsletter. Roseville Area & St. Anthony Schools in Minnesota was highlighted on social media channels.
RETAIL DATA
- Coded all the organic and random versus fixed-weight mushroom data. Those sections of the retail tracker now reflect the full market level, instead of just SKU data. This is a big deal because SKU data does not include some retailers and private brands due to IRI contract restrictions.
FOODSERVICE
- Mod Pizza, the fast casual pizza pioneer, launched the “Make Room for Shrooms” campaign with their Super Shroom Pizza and Super Mushroom Salad on Jan 18th in all 500 locations. According to Chef Scott, “Sales are twice that of any recent LTO.”
The Super Shroom Pizza starts with a mushroom pesto base and is topped with fresh mushrooms, shredded mozzarella, mild pork sausage, fresh spinach, garnished with fresh rosemary. The Super Shroom Salad is packed with flavor, starting with spinach and spring mix lettuce, topped with fresh mushrooms, balsamic marinated mushrooms, roasted corn, crumbled bacon, roasted red peppers and balsamic vinaigrette.
CAMPAIGN Metrics
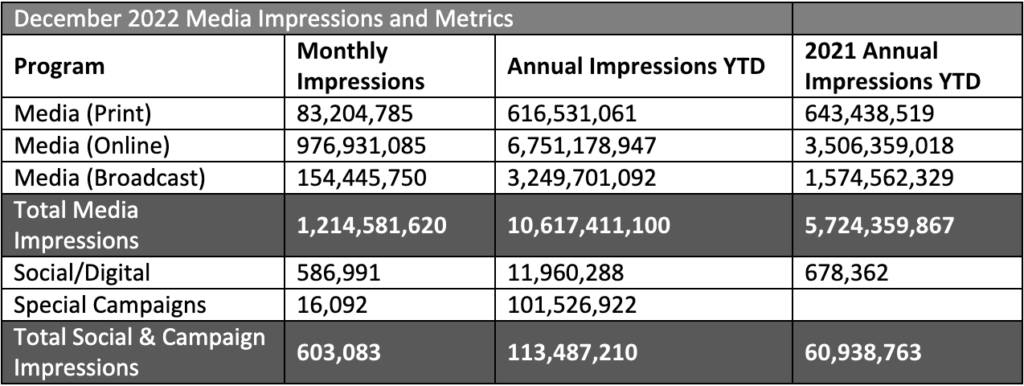
Notable Impressions Highlights:
- December
- Our syndicated article “A Savory Solution to Stretch Your Grocery Budget” rounded out the year with 12 new placements and over 200,000 impressions in the month of December.
- As we scaled back on promotions and budget in December, we saw a decrease in monthly impressions and engagements. The amount of spend is adjacent to the social platform’s post-performance.
- We saw another monthly increase in our e-newsletter open rate; the email was holiday themed, providing “12 days of mushroom recipes.”
- Overall, our 2022 Social & Campaign Impressions far exceeded Impressions from 2021 (an increase of 186%).
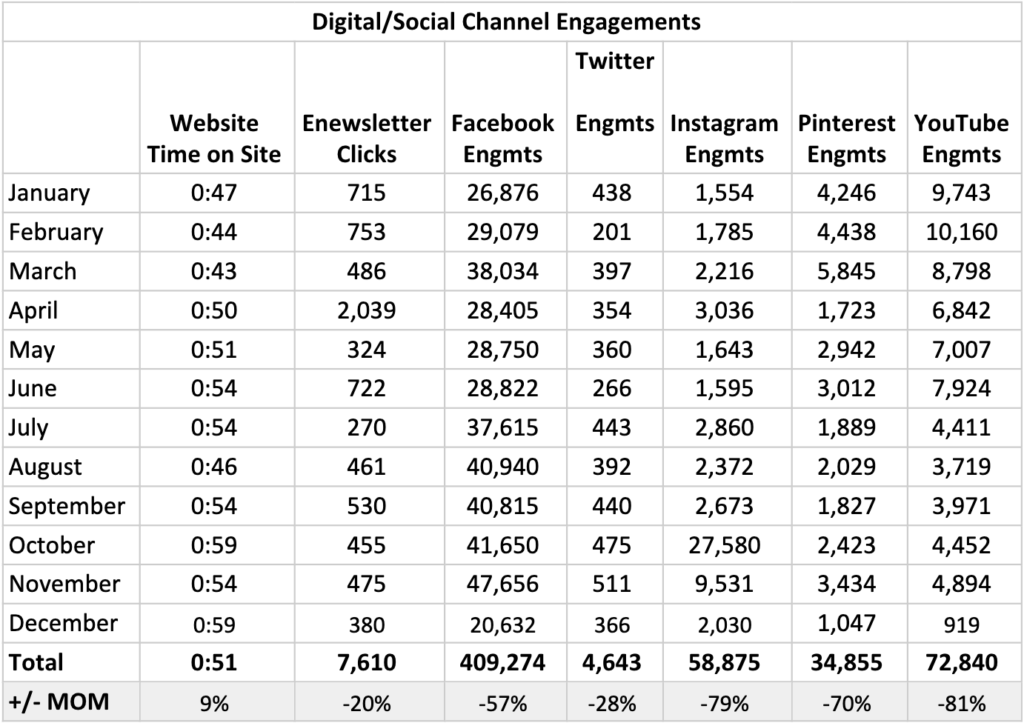
| *Youtube Engagament metrics have changed. Digital metrics are constantly evolving, so we created our own updated Engagement metrics (comments + shares + likes + dislikes + subscribers lost + subscribers gained) |
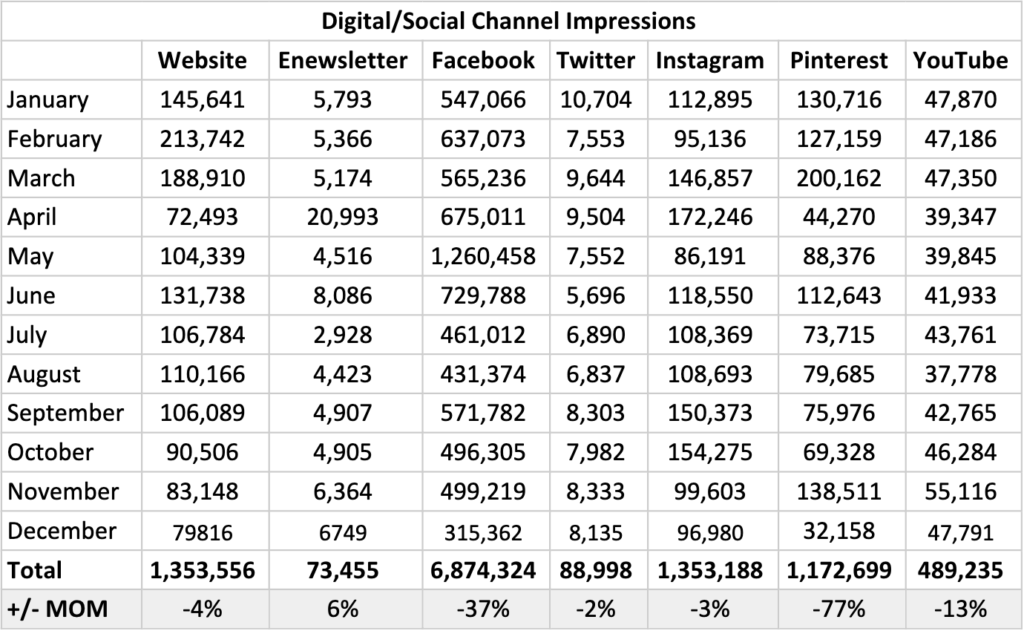
Special Campaign Impressions
Includes paid promotions, partnerships and advertising activities.
Previous Months’ Highlights
- January: Feed Your Immune System – The revamped “Feed Your Immune System” campaign kicked off in January, leading to an increase in social impressions across nearly all channels.New digital banner ads in January contributed to 7M impressions – helping to surpass January 2021 impressions.
- Influencer impressions decreased from 2021 with a stronger focus on engagements (views, clicks) as video becomes a primary way to reach audiences with our messages.Noteably: Engagements nearly doubled and clicks to site more than tripled.
- Instagram Reels and new animations helped to increase Instagram impressions by nearly 200%, while the website also saw a dramatic increase in pageviews due to the campaign landing page traffic.
- The FeedYourImmuneSystem.com landing page received nearly 60k pageviews in January – a 411% increase from January 2021.
- February: Feed Your Immune System – February saw continued success for the FYIS campaign as numbers built and surpassed January metrics, especially on the website:
- The FeedYourImmuneSystem.com landing page received more than 150k pageviews in February – a 156% increase from January and 400% increase from ALL of Q1 2021 (1346% compared to February 2021).
- Avg. time on page stayed around 5 minute (4:59) – still surpassing the site average of 2-3 minutes.
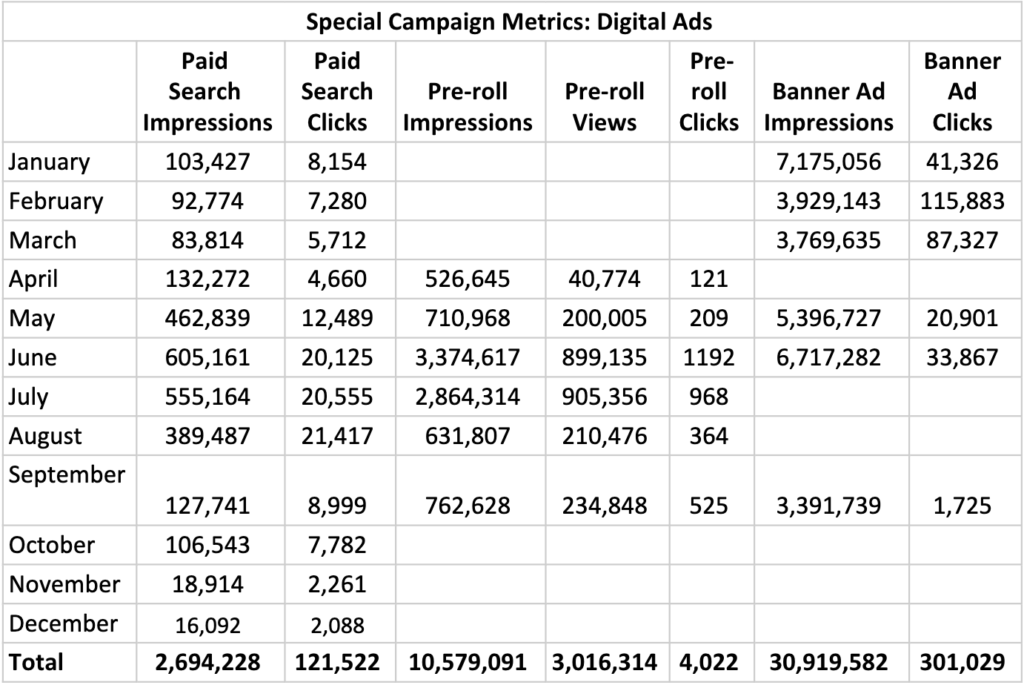
- A majority of the traffic came from the FYIS banners ads (115,883 clicks to page from these ads). While we saw higher impressions for the banner ads in January, we changed bidding strategies to ensure we are reaching an engaged audience – which by evidence of clicks, we are.
- The FeedYourImmuneSystem.com landing page received more than 150k pageviews in February – a 156% increase from January and 400% increase from ALL of Q1 2021 (1346% compared to February 2021).
- March: Feed Your Immune System – The Q1 campaign wrapped up in March with results that outpaced 2021’s award-winning campaign. Most notably:
- The FeedYourImmuneSystem.com landing page received more than 10x the pageviews compared to 2021.
- The Banner Ads (new in 2022) were instrumental in getting eyes and traffic to the landing page – contributing to more than 240,000 clicks to site and 61% of all Social/Digital Impressions in 2022.
- The drop in impressions throughout the quarter was due to bidding strategies changing to target more audiences that would click.
- April: Earth Month – Mushroom Council kicked off Earth Month with the “Mushrooms – The Official Ingredient of Earth Month” campaign, which resulted in our most successful campaign to date this year (measured by impressions and engagements).
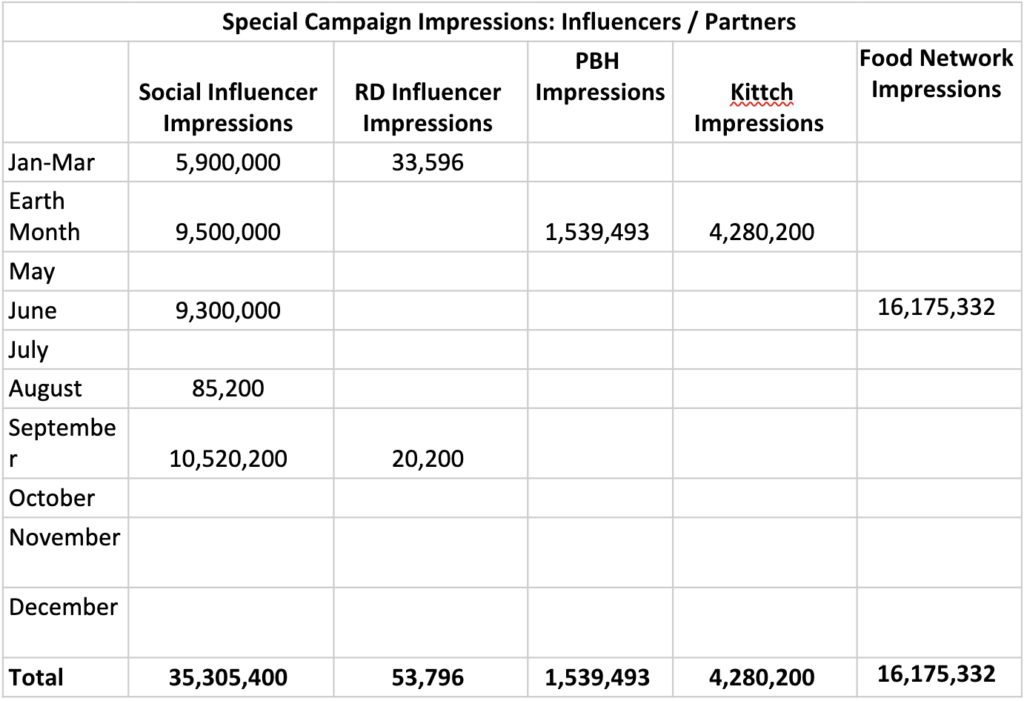
- The vast majority of impressions (90%) were the result of our Earth Month partnerships: Kittch (4.2M), Social Influencers (9.5M) and Produce for Better Health (1.6M).
- During April, we increased consumer elbasts to weekly, resulting in a 300% increase in opens and clicks.
- Website impressions (pageviews) saw a decrease due to the majority of MC promotions pointing users to the Mushroom Council Kittch channel to watch the daily streams (vs. pointing to our own site).
- Instagram Reels sharing chef stream “cut downs” (created in partnership with Kittch) helped to increase Instagram impressions (+17%) and engagement (+37%).
- May: National Burger Month – Mushroom Council kicked off its Food Network promotions and Blended Burger Contest in May. While we are still waiting on reporting from Food Network for May activities, we did see some notable highlights:
- Facebook Impressions increased by nearly 90% due to the increase in paid support and promotions for the Blended Burger Contest.
- Pinterest Impressions doubled (+100%) from April due to increased burger pins and added spend.
- Website traffic increased (+44%) due to promotions pointing to the Blended Burger Contest page on MC.com, with the page itself accounting for 25% of all pageviews from May.
- The Enewsletter saw a dramatic decrease in Opens and Clicks. This is due to scaling back to our cadence of 1x/month communications. In April, we sent out weekly eblasts promoting our Kittch chefs, which dramatically increased Total Opens/Clicks.
- June: The Food Network Blended Burger Contest kicked off in May and ran until June 27th. While we are still waiting on reporting from Food Network for May & June activities, we did see some notable highlights:
- Digital Campaign Impressions and Engagement saw a 63% increase from May. We attest this to grilling season, the Blended Burger Contest, and our Clever Influencer partnership.
- Website traffic increased (+26%) from May due to promotions pointing to the Blended Burger Contest page on MC.com. Session duration also saw an increase (0:54), the longest duration YTD.
- The Enewsletter saw a dramatic increase in Opens and Clicks. This is due to our additional email, Blended Burger Contest – “One Week Left” Reminder.
- July: The Food Network Blended Burger Contest ended in June. We kicked off the micro-campaign; value in response to inflation. The messaging for this campaign is centered around mushrooms are essentail, an answer to rising food costs. While this is a micro-campaign, we did see some notable highlights:
- Social Engagement (FB, Twitter, IG) saw a 69% increase from June. Posts about mushroom sustainability, meme/infographic-style posts, and a recipe share from The Kitchn generated the most engagements. July post copy was also shorter and used more emojis than June post copy.
- Website traffic decreased by 19%. We attest this drop due to traffic driving increases from Food Network the prior month.
- Pre-roll Impressions and Views continues to perform well above our monthly average with 2,864,314 Impressions and 905,356 views. We ran 2 ads in July, blended and value content.
- E-newsletter metrics decreased; we sent 1 email in July, 2 emails in June.
- August: In anticipation of Mushroom Month, we released a syndicated article that quickly gained traction, resulting in approximately 12.6M impressions
- Our monthly Enewsletter saw a 51% increase in opens and 71% increase in clicks. We attest this to our catchy subject line “Mushrooms are the Answer” and engaging Value content within the email.
- Due to our Value campaign, website traffic increased (+3%) with a decrease (-15%) time on site. We expected to see a minor dip in numbers compared to the Blended Burger contest months.
- Although we saw a minor decrease in social impressions, we saw an increase in engagement for Twitter and Instagram. Recipe posts were top performing posts.
- September was National Mushroom Month:
- Our syndicated article “A Savory Solution to Stretch Your Grocery Budget” continued to perform well, with over 4,000 placements and over 13 million impressions.
- Due to National Mushroom Month, social channels (Facebook, Twitter, Instagram) saw a signifacant increase in impressions and engagement.
- Our site saw a 17% increase in time on site. We attest this to the launch of our National Mushroom Month landing page, featuring robust content on how Mushrooms are the Answer to… and a tote bag sweepstakes.
- We saw a drop in Pinterest engagement (-10%), our team has proactively worked with Pinterest to optimize the recipes with visibility to ingredient lists, timing, and servings now available.
- October
- Our syndicated article “A Savory Solution to Stretch Your Grocery Budget” continued to perform well, with over 100 placements and over 4.1 million impressions in the month of October.
- We’ve seen a steady increase in duration on our consumer site since we’ve refreshed the website; reaching 59 seconds, the highest this year.
- You’ll notice a sizeable jump in Instagram engagement numbers as we combine organic and paid metrics moving forward.
- Social engagement metrics have increased likely due to our recipe content. Viewers ask questions and leave comments more often within our recipe posts.
- According to fourth-quarter planning, ad spend and impressions taper down.
- November
- Our syndicated article “A Savory Solution to Stretch Your Grocery Budget” continued to perform well, with over 35 new placements and over 1.5 million impressions in the month of November.
- In November, we decreased spend on Instagram and increased spend on Facebook. The amount of spend is adjacent with the social platform’s post performance.
- We also saw an increase in performance on FB with Thanksgiving-related recipes, specifically this post and this post. As for Instagram, October was an especially standout month with this reel performing extremely well and producing over 11k impressions.
- We saw a 30% increase in our enewsletter open rate; the email was Thanksgiving themed, providing hosting tips and recipes.
Topline Report
Tracker Highlights – Period ending 01/01/2023
- Download Retail Tracker for Period ending 01/01/2023
- Download Fresh Mushroom Sales Review for Period ending 01/01/2023
- Download Mushroom Retail Performance for Period ending 01/01/2023
The Marketplace
The year ended the way it started, with inflation taking the headlines.
- According to the December IRI primary shopper survey, 93% believe groceries cost somewhat or a lot more than last year and 97% are somewhat or a lot concerned about it — lower-income households in particular.
- Inflationary pressure on income is real: 43% of consumers say their current financial situation is worse than last year. Additionally, 31% expect it to be worse a year from now versus 27% who believe it will be better.
- This has prompted a host of money-saving measures when buying groceries among 82% of Americans, such as buying what’s on sale (53%), cutting back on non-essentials (45%), looking for coupons (35%) and switching to store brand items (31%).
- December saw a sharp uptick in the estimated share of meals prepared at home to 81.5%. Holiday occasions as well as the recent increase in flu and COVID cases could be influencing factors.
- The share of households who purchased restaurant meals dropped from 80% in November to 76% in December. Takeout (52%) and eating on premise (46%) were the most common ways to purchase restaurant meals, with delivery more popular among younger consumers.
- Lunch is one of the areas where consumers are looking to save on restaurant meals. Among away-from-home workers, 38% packed lunch more often. At the same time, 25% looked for lower-cost options and 25% for what’s on sale when deciding what to take to work for lunch.
Dollars, Units and Volume Performance
The persistent high level of inflation is continuing the now familiar sales patterns for most departments around the store, including fresh produce. In 2022, the produce department reached $75 billion, up 4.8% year-on-year. However, pound sales were down 3.6% and fell below 2021 and 2020 levels. In the fourth quarter, dollar gains for fresh produce were below that of total food and beverages as inflation is slowing down rapidly on the fruit side. Additionally, fresh fruit and vegetables lost share to frozen and canned as consumers emphasized price and shelf-life. Total produce department patterns have an impact on commodity-specific patterns also.
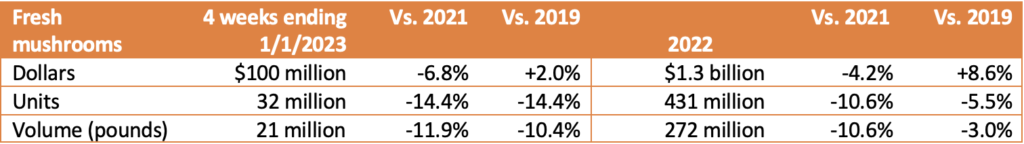
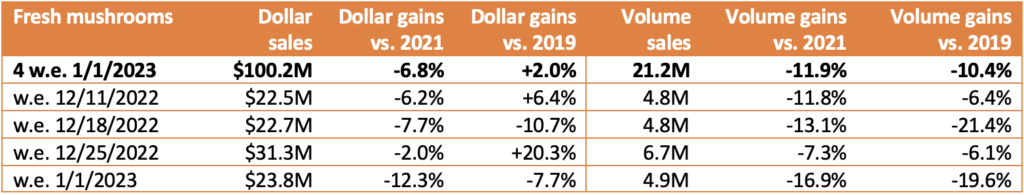
For the four weeks ending January 1st, 2023, fresh mushroom dollars decreased 6.8% year-over-year and volume declined by 11.9%. In calendar year 2022, dollars were down 4.2% versus year ago and pounds 10.6%. Dollars remained ahead of 2019 in both the shorter- and longer-term views, but pounds are now 3.0% behind those of 2019 in the year-to-date views and 10.4% in the quad-week view versus pre-pandemic.
- Weekly sales for mushrooms peaked Christmas week, at $31.3 million versus the typical level of around $22.5 million. New Year’s week also saw an improvement over typical levels. However, pounds during the week of Christmas were 7.3% down versus year ago and 6.1% versus the 2019 pre-pandemic level. Sales patterns did hold, but at a lower level than typically seen during this time of year. Prior-year patterns show an increase in mushroom sales from August through the end of the year (see forecast tab). This quad week period is typically one of the biggest ones.
Inflation
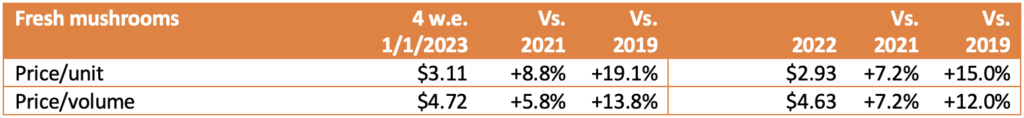
- Mushroom prices per unit increased by 8.8% versus year ago in the latest quad-week period. This means the rate of inflation jumped ahead of that for total fresh vegetables (+8.4%) and total fresh produce (+4.8%).
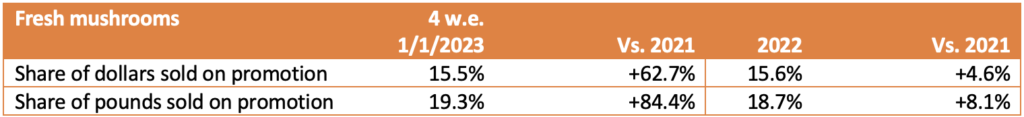
- Promotional activity improved in December, at 15.5% of total fresh mushroom dollars and 19.3% of total pounds sold. This was quite a bit more than December last year.
Performance by segment
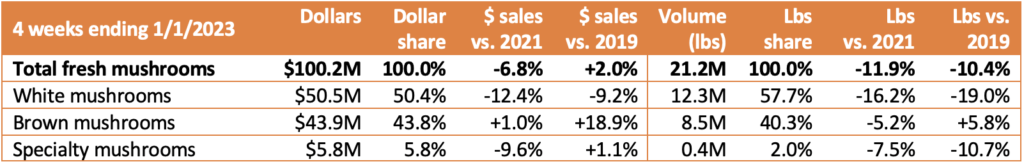
- White mushrooms represented 50.4 % of total fresh mushroom sales and 57.7% of pounds in the four-week period. However, it was brown mushrooms, the combination of criminis and portabellas, that fared better with 5.8% pound growth over the 2019 levels, whereas white mushrooms were down 19.0%.
Additional observations:
- Package size: Eight-ounce packages are, by far, the biggest seller and is outperforming 16 ounces in growth.
- Organic vs. conventional: Organic mushrooms made up 10.7% of pounds but far outperformed conventional mushrooms in performance in dollars, units and volume.
- Cut/prepared versus whole mushrooms: Cut or prepared mushrooms made up 45.3% of pound sales in the four-week period. Mushrooms without preparation had the better performance.
IRI, Integrated Fresh, MULO, YTD and 4 weeks ending 01/01/2023
We collect, use and process your data according to our Privacy Policy.