 Shipping Reports
Monthly Shipping and Marketing Report | October 2022
Council Update
Webinar: Fresh Mushroom Retail Best Practices
Tuesday, October 4th
3pm Eastern | 12pm Pacific
CLICK HERE TO REGISTER
August brought more rising prices, subdued promotional activity and continued supply chain challenges. Consumers are concerned and making changes to their grocery selections. That means even greater pressure on making the right pricing, promotional and distribution decisions across products, brands, and channels. Getting these decisions right is vital in today’s competitive and shopper-centric environment.
Brought to you by the Mushroom Council, Rick Belber, IRI’s Principal, Commercial Leader will share fresh mushroom best practices based on an extensive study of how consumers react to strategic pricing and promotional changes across channels, regions, pack sizes, types, and varieties.
This information has tremendous value throughout the planning process, such as:
- Better collaboration with key partners
- More precise understanding of expected impact on volume
- Optimized management of COGs inflation
- Developing promotions that resonate with shoppers
- Understanding price ladders founded in consumer perception
Please join us for this highly informative and collaborative session.
Like all Mushroom Council webinars, this webinar will be recorded and posted on MushroomCouncil.org for on-demand viewing.
Open Positions on the Council (2023-2025 term):
Background forms and other information has been sent to the Secretary of Agriculture for appointments.
- Region 1 (All states except CA & PA) – two open positions (3-year terms)
- Region 2 (PA) – one open position (3-year term)
- Region 4 (Imports) – one open position for a 1+ year term
Shipment Summary
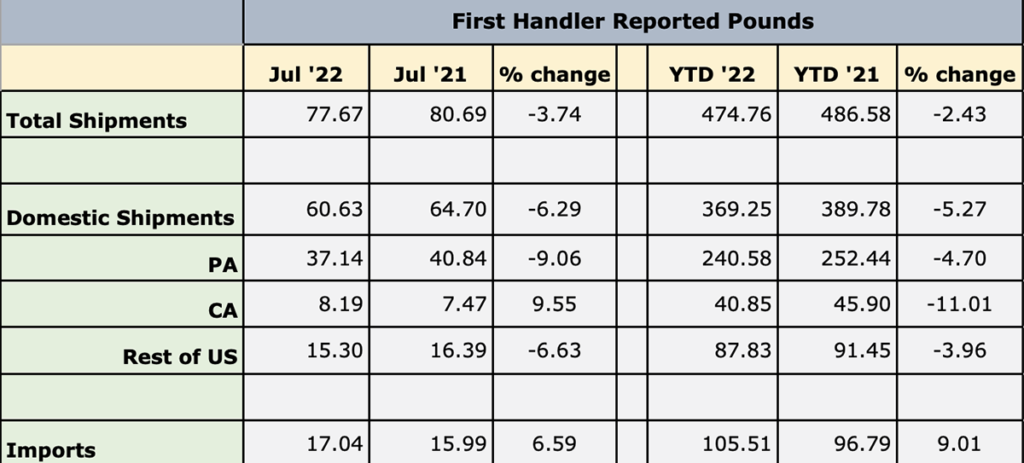
To see current charts, click here.
The Month Ahead
SCHOOL NUTRITION
- In October, Mushrooms in Schools will be celebrating National School Lunch Week (NSLW) and National Mushroom Day. We will be amplifying new resources to celebrate NSLW through social media, blog, and newsletter. Additionally, we will be highlighting recipes and other resources school districts can use in kitchens. We encourage other channels to amplify Mushrooms in Schools by sharing our posts on Facebook and Twitter.
Highlights from September
SCHOOL NUTRITION
- Mushrooms in Schools exhibited at the 2022 Urban School Food Alliance Meeting in Baltimore, MD. Mushrooms in Schools promoted resources through social media channels discussing Mushroom Month. We provided our audience with resources on how to select mushrooms, how mushrooms grow, and recipes.
Metrics
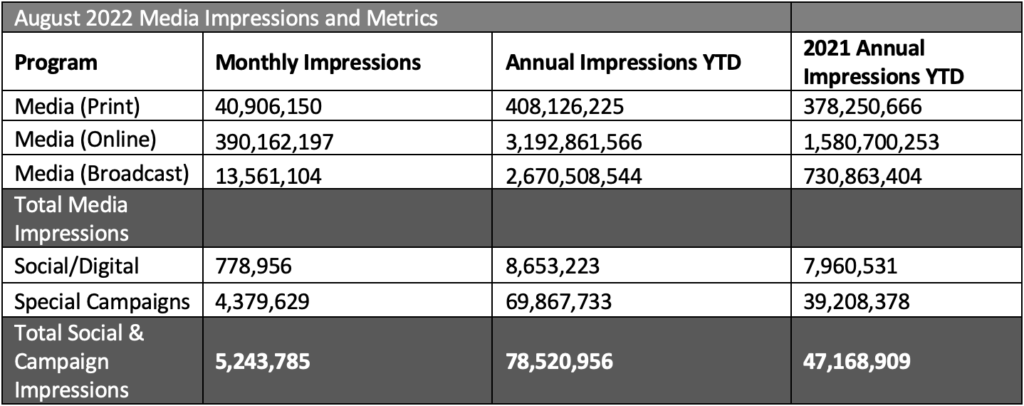
Notable Impressions Highlights:
- August: In anticipation of Mushroom Month, we released a syndicated article that quickly gained traction, resulting in approximately 12.6M impressions
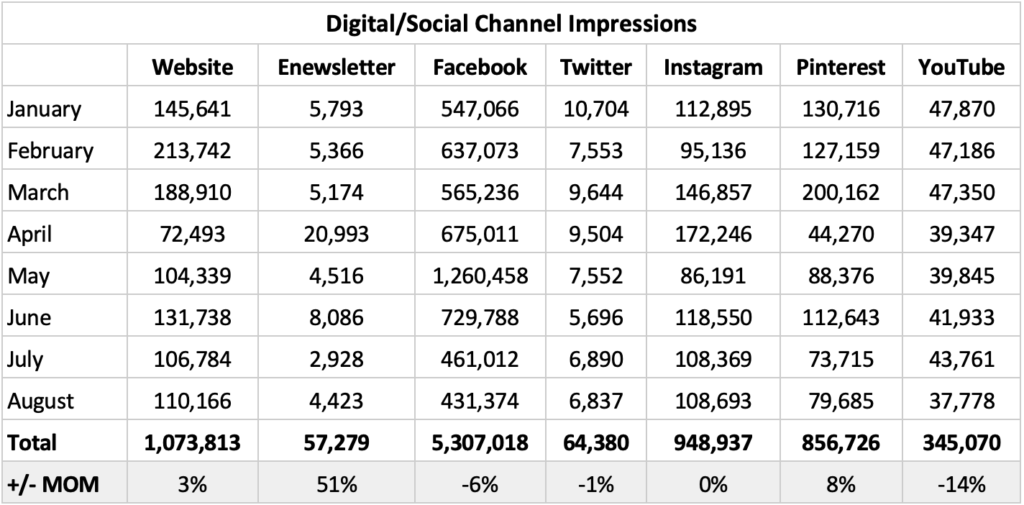
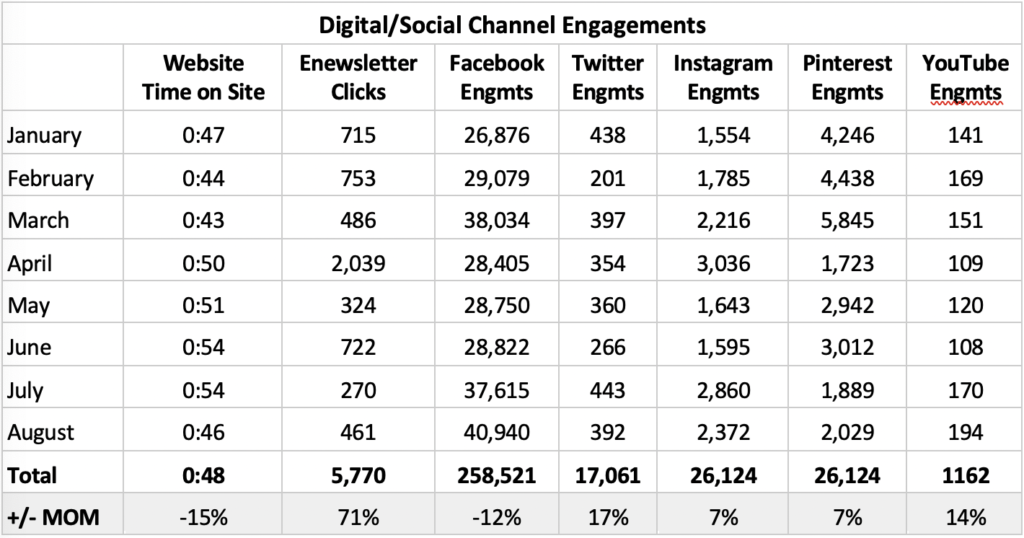
- Our monthly Enewsletter saw a 51% increase in opens and 71% increase in clicks. We attest this to our catchy subject line “Mushrooms are the Answer” and engaging Value content within the email.
- Due to our Value campaign, website traffic increased (+3%) with a decrease (-15%) time on site. We expected to see a minor dip in numbers compared to the Blended Burger contest months.
- Although we saw a minor decrease in social impressions, we saw an increase in engagement for Twitter and Instagram. Recipe posts were top performing posts
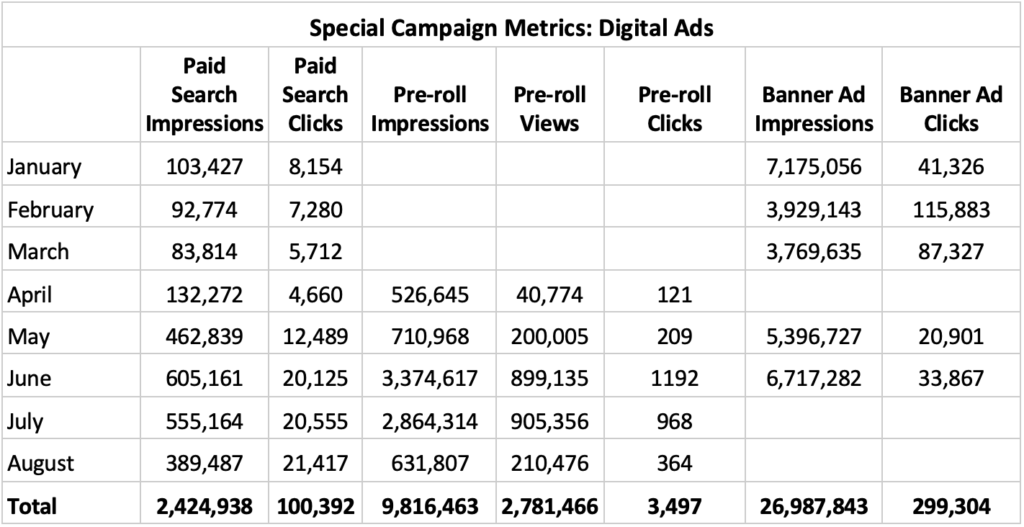
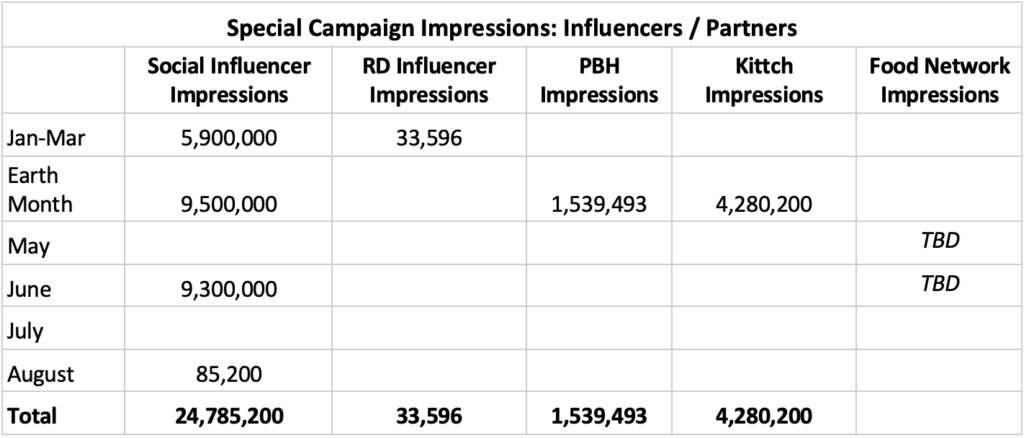
Special Campaign Impressions
Includes paid promotions, partnerships and advertising activities.
Previous Months’ Highlights
- January: Feed Your Immune System – The revamped “Feed Your Immune System” campaign kicked off in January, leading to an increase in social impressions across nearly all channels.New digital banner ads in January contributed to 7M impressions – helping to surpass January 2021 impressions.
- Influencer impressions decreased from 2021 with a stronger focus on engagements (views, clicks) as video becomes a primary way to reach audiences with our messages.Noteably: Engagements nearly doubled and clicks to site more than tripled.
- Instagram Reels and new animations helped to increase Instagram impressions by nearly 200%, while the website also saw a dramatic increase in pageviews due to the campaign landing page traffic.
- The FeedYourImmuneSystem.com landing page received nearly 60k pageviews in January – a 411% increase from January 2021.
- February: Feed Your Immune System – February saw continued success for the FYIS campaign as numbers built and surpassed January metrics, especially on the website:
- The FeedYourImmuneSystem.com landing page received more than 150k pageviews in February – a 156% increase from January and 400% increase from ALL of Q1 2021 (1346% compared to February 2021).
- Avg. time on page stayed around 5 minute (4:59) – still surpassing the site average of 2-3 minutes.
- A majority of the traffic came from the FYIS banners ads (115,883 clicks to page from these ads). While we saw higher impressions for the banner ads in January, we changed bidding strategies to ensure we are reaching an engaged audience – which by evidence of clicks, we are.
- The FeedYourImmuneSystem.com landing page received more than 150k pageviews in February – a 156% increase from January and 400% increase from ALL of Q1 2021 (1346% compared to February 2021).
- March: Feed Your Immune System – The Q1 campaign wrapped up in March with results that outpaced 2021’s award-winning campaign. Most notably:
- The FeedYourImmuneSystem.com landing page received more than 10x the pageviews compared to 2021.
- The Banner Ads (new in 2022) were instrumental in getting eyes and traffic to the landing page – contributing to more than 240,000 clicks to site and 61% of all Social/Digital Impressions in 2022.
- The drop in impressions throughout the quarter was due to bidding strategies changing to target more audiences that would click.
- April: Earth Month – Mushroom Council kicked off Earth Month with the “Mushrooms – The Official Ingredient of Earth Month” campaign, which resulted in our most successful campaign to date this year (measured by impressions and engagements).
- The vast majority of impressions (90%) were the result of our Earth Month partnerships: Kittch (4.2M), Social Influencers (9.5M) and Produce for Better Health (1.6M).
- During April, we increased consumer elbasts to weekly, resulting in a 300% increase in opens and clicks.
- Website impressions (pageviews) saw a decrease due to the majority of MC promotions pointing users to the Mushroom Council Kittch channel to watch the daily streams (vs. pointing to our own site).
- Instagram Reels sharing chef stream “cut downs” (created in partnership with Kittch) helped to increase Instagram impressions (+17%) and engagement (+37%).
- May: National Burger Month – Mushroom Council kicked off its Food Network promotions and Blended Burger Contest in May. While we are still waiting on reporting from Food Network for May activities, we did see some notable highlights:
- Facebook Impressions increased by nearly 90% due to the increase in paid support and promotions for the Blended Burger Contest.
- Pinterest Impressions doubled (+100%) from April due to increased burger pins and added spend.
- Website traffic increased (+44%) due to promotions pointing to the Blended Burger Contest page on MC.com, with the page itself accounting for 25% of all pageviews from May.
- The Enewsletter saw a dramatic decrease in Opens and Clicks. This is due to scaling back to our cadence of 1x/month communications. In April, we sent out weekly eblasts promoting our Kittch chefs, which dramatically increased Total Opens/Clicks.
- June: The Food Network Blended Burger Contest kicked off in May and ran until June 27th. While we are still waiting on reporting from Food Network for May & June activities, we did see some notable highlights:
- Digital Campaign Impressions and Engagement saw a 63% increase from May. We attest this to grilling season, the Blended Burger Contest, and our Clever Influencer partnership.
- Website traffic increased (+26%) from May due to promotions pointing to the Blended Burger Contest page on MC.com. Session duration also saw an increase (0:54), the longest duration YTD.
- The Enewsletter saw a dramatic increase in Opens and Clicks. This is due to our additional email, Blended Burger Contest – “One Week Left” Reminder.
- July: The Food Network Blended Burger Contest ended in June. We kicked off the micro-campaign; value in response to inflation. The messaging for this campaign is centered around mushrooms are essentail, an answer to rising food costs. While this is a micro-campaign, we did see some notable highlights:
- Social Engagement (FB, Twitter, IG) saw a 69% increase from June. Posts about mushroom sustainability, meme/infographic-style posts, and a recipe share from The Kitchn generated the most engagements. July post copy was also shorter and used more emojis than June post copy.
- Website traffic decreased by 19%. We attest this drop due to traffic driving increases from Food Network the prior month.
- Pre-roll Impressions and Views continues to perform well above our monthly average with 2,864,314 Impressions and 905,356 views. We ran 2 ads in July, blended and value content.
- E-newsletter metrics decreased; we sent 1 email in July, 2 emails in June.
Topline Report
Tracker Highlights – Period ending 09/04/2022
- Download Retail Tracker for Period ending 09/04/2022
- Download Fresh Mushroom Sales Review for Period ending 09/04/2022
- Download Mushroom Retail Performance for Period ending 09/04/2022
Inflation remained a major undercurrent for the latest retail performance results covering the four weeks ending September 4, 2022. Food and beverage prices rose even further to +14.5% year-on-year and +26.2% versus 2019, the pre-pandemic level.
- Consumers are feeling the pain and 32% of American households are having difficulty affording needed groceries, according to the August IRI shopper survey.
- Widespread worry about the elevated gasoline prices (89% of consumers) and food inflation (94%), is prompting shoppers to pull back on units and volume across categories as a way to save.
- Total food and beverage unit sales trailed 2019 by 5% during the quad-week period. Units in the fresh perimeter were down 4%, including down results for staples such as chicken, beef, bakery and dairy.
- Eight in 10 consumers made changes to where, what and how they bought groceries. The dominant changes are looking for sales specials (50%), skipping non-essentials (41%), finding coupons (31%) and buying more private or other low-cost brands (31%).
- Despite the high gas prices, 15% cherry pick specials across retailers and 15% now do some of their shopping at lower-cost retailers. This has resulted in traditional grocery losing share whereas value formats, including supercenters and club, have been gaining ground.
- In-person trips remain prevalent, at 85%, with the remainder equally divided between click-and-collect and delivery. Takeout is biggest in restaurant trips, with 54% of consumers having orders meals to go.
Dollars, Units and Volume Performance
The high inflation is driving a bigger gap between dollars and volume for most departments, including produce. Per IRI data, total fresh departments experienced an 8.4% increase in dollars, but 4.1% decline in units during the quad-week period, with price inflation of 13.1% versus year ago. Fresh produce sales reached $5.9 billion during the four-week period, which was up 4.8% versus last year. However, gains were inflation-driven with units down 4.8% and volume down 5.4% year-on-year.
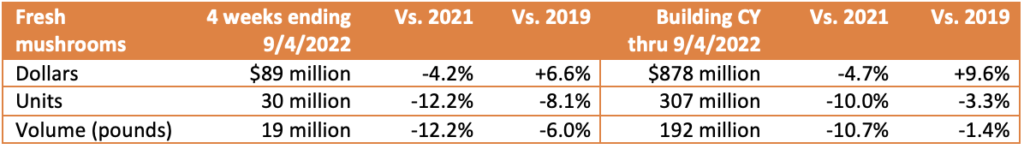
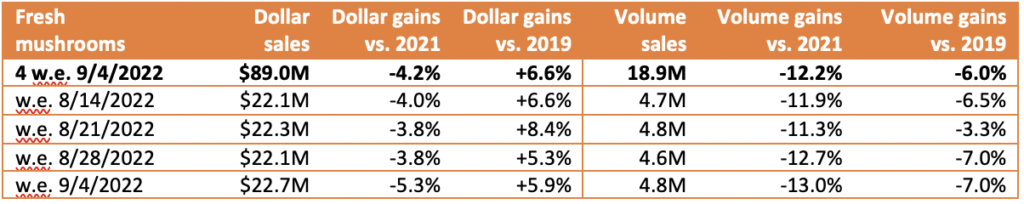
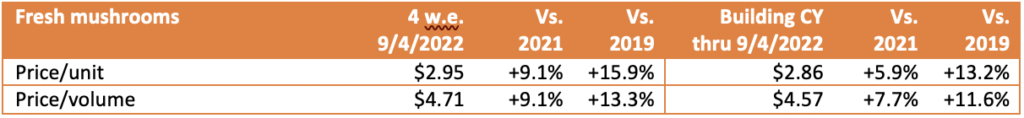
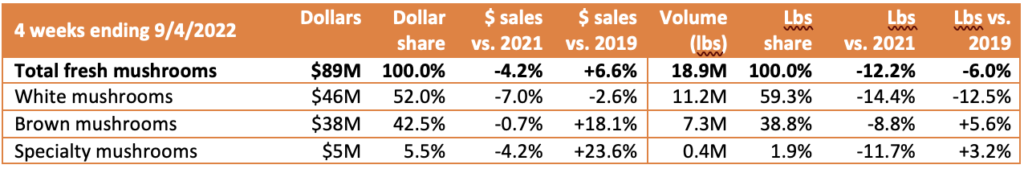
For the four weeks ending September 4th, 2022, fresh mushroom dollars decreased 4.2% year-over year and volume declined by 12.2%. When compared with the pre-pandemic normal of 2019, dollars were 9.6% higher while volume was down 1.4%.
- Despite inflation, promotional activityWeekly sales for mushrooms averaged between $22.1 and $22.7 million, which was an improvement for each when compared to the prior quad week period. Total pounds increased slightly compared to the prior quad-week as well — following prior-year patterns that show an increase in mushroom sales from August through the end of the year (see forecast tab).
Inflation
- While mushroom prices increased by 9.1% versus year ago in the latest quad-week period, they continue to track behind the rate of increase for total vegetables (+10.5%), produce (+10.1%) and the total fresh perimeter (+13.1%) that includes produce, meat, seafood, bakery, deli and dairy.
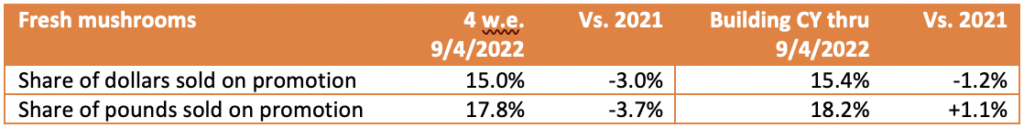
- Despite inflation, promotional activity remained low, at 15.0% of total dollars and 17.8% of total pounds sold. Promotional levels remain subdued for all of fresh produce as well as total food and beverages.
Performance by segment
- White mushrooms represented 52.0% of total fresh mushroom sales and 59.3% of pounds in the four-week period. However, it was brown mushrooms, the combination of criminis and portabellas, that fared better with 5.6% pound growth over the 2019 levels, whereas white mushrooms were down 12.5%.
Additional observations:
- Packaged vs. bulk: Pre-packaged represented 95.5% of pounds and outperformed bulk in dollars/pounds.
- Organic vs. conventional: Organic mushrooms made up 10.7% of pounds and 13.8% of dollars. Organic far outperformed conventional in dollars, units and volume.
- Cut/prepared versus whole mushrooms: Cut or prepared mushrooms made up 53.6% of dollar sales in the four-week period. Mushrooms without preparation had the better performance.
- Package size: Eight-ounce packages are, by far, the biggest seller and had the best performance of all sizes.
IRI, Integrated Fresh, MULO, YTD and 4 weeks ending 09/04/2022
We collect, use and process your data according to our Privacy Policy.