 Shipping Reports
Monthly Shipping and Marketing Report | August 2022
Council Update
***SAVE THE DATE***
Annual Industry Meeting – Wednesday, September 7, 4:30-6 pm ET at The Red Clay Room located at 423 Dalmation St., Kennett Square, PA.
Join the Mushroom Council to hear from leading Retail and Foodservice experts:
- What is the current performance and outlook?
- What do we know about our target audiences today?
- How are our audiences responding to today’s market dynamics?
- Preview 2023 marketing/demand development strategies
Open Positions on the Council (2023-2025 term):
Ballots are in and the nominees are completing background forms and the Council is gathering information to send to the Secretary of Agriculture for appointments.
- Region 1 (All states except CA & PA) – two open positions (3-year terms)
- Region 2 (PA) – one open position (3-year term)
- Region 4 (Imports) – one open position for a 1+ year term
Thank you to all who participated in the nominations and voting!
Next Council Meeting – September 8, 2022, in Kennett Square, PA
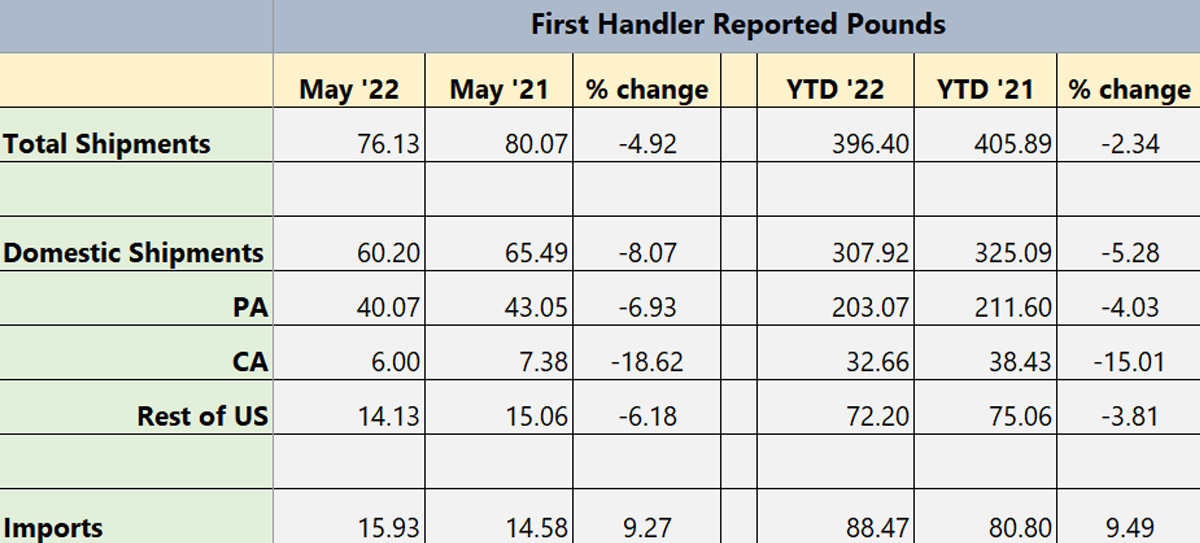
Shipment Summary

To see current charts, click here.
The Month Ahead
SCHOOL NUTRITION
- In August, Mushrooms in Schools will be discussing all things back to school. We will be amplifying some of our current resources for school nutrition professionals through social media and newsletter. Additionally, we will be highlighting monthly holidays. We encourage other channels to amplify Mushrooms in Schools by sharing our posts on Facebook and Twitter.
Highlights from July
SCHOOL NUTRITION
- Mushrooms in Schools traveled to Orlando, FL for the School Nutrition Association’s Annual Nutrition Conference. As an exhibitor, we created more buzz on adding mushrooms in schools as well as several school districts excited to try our recipes on their menus this school year. Additionally, we highlighted our Mushrooms Sourcing Catalog and simple videos for families to use portabella mushrooms.
Upcoming Events
SCHOOL NUTRITION
- Mushrooms in Schools is exhibiting at the 2022 School Nutrition Association’s Annual Nutrition Conference in Orlando, Florida during July 10-12. If you are interested in attending please register here or contact Malissa Marsden to discuss your involvement.
Metrics
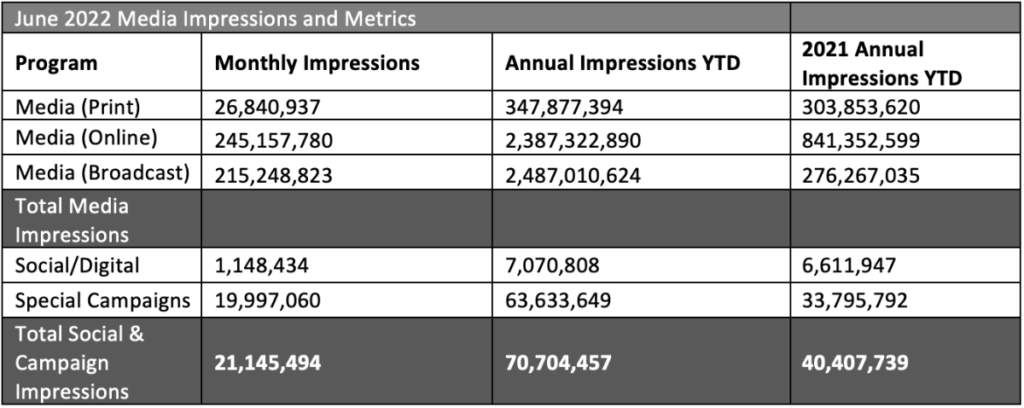
Notable Impressions Highlights:
- June: The Food Network Blended Burger Contest kicked off in May and ran until June 27th. While we are still waiting on reporting from Food Network for May & June activities, we did see some notable highlights:
- Digital Campaign Impressions and Engagement saw a 63% increase from May. We attest this to grilling season, the Blended Burger Contest, and our Clever Influencer partnership.
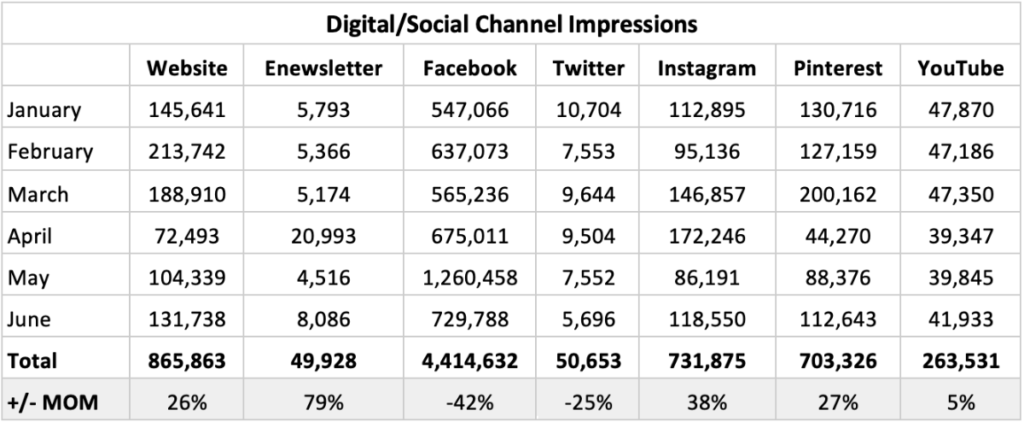
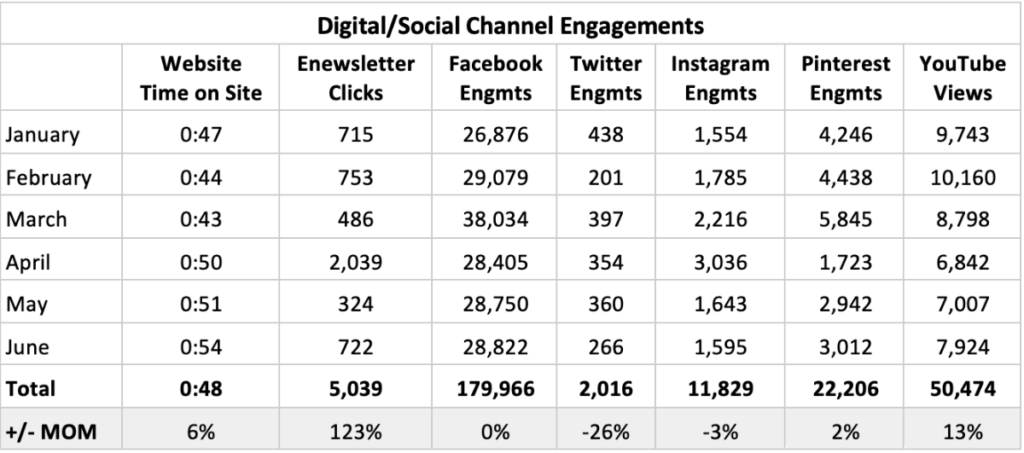
- Website traffic increased (+26%) from May due to promotions pointing to the Blended Burger Contest page on MC.com. Session duration also saw an increase (0:54), the longest duration YTD.
- The Enewsletter saw a dramatic increase in Opens and Clicks. This is due to our additional email, Blended Burger Contest – “One Week Left” Reminder.
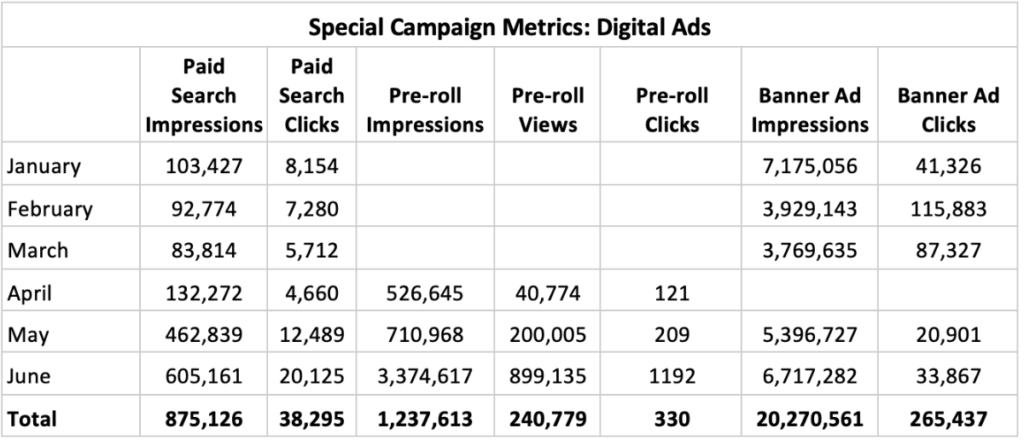
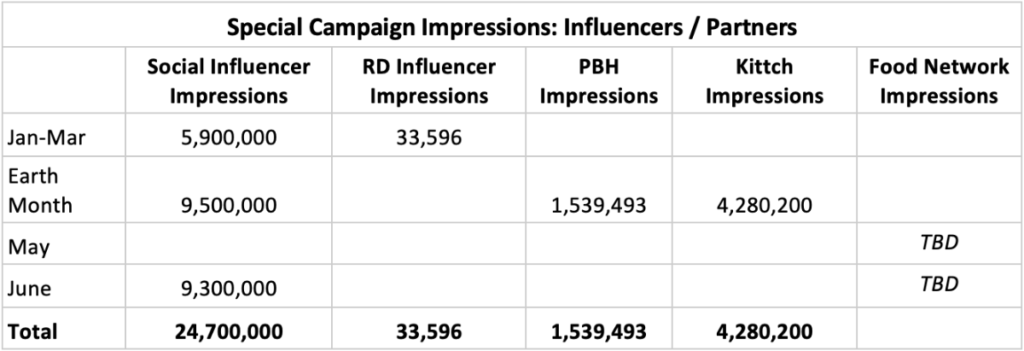
Special Campaign Impressions
Includes paid promotions, partnerships and advertising activities.
Previous Months’ Highlights
- January: Feed Your Immune System – The revamped “Feed Your Immune System” campaign kicked off in January, leading to an increase in social impressions across nearly all channels.New digital banner ads in January contributed to 7M impressions – helping to surpass January 2021 impressions.
- Influencer impressions decreased from 2021 with a stronger focus on engagements (views, clicks) as video becomes a primary way to reach audiences with our messages.Noteably: Engagements nearly doubled and clicks to site more than tripled.
- Instagram Reels and new animations helped to increase Instagram impressions by nearly 200%, while the website also saw a dramatic increase in pageviews due to the campaign landing page traffic.
- The FeedYourImmuneSystem.com landing page received nearly 60k pageviews in January – a 411% increase from January 2021.
- February: Feed Your Immune System – February saw continued success for the FYIS campaign as numbers built and surpassed January metrics, especially on the website:
- The FeedYourImmuneSystem.com landing page received more than 150k pageviews in February – a 156% increase from January and 400% increase from ALL of Q1 2021 (1346% compared to February 2021).
- Avg. time on page stayed around 5 minute (4:59) – still surpassing the site average of 2-3 minutes.
- A majority of the traffic came from the FYIS banners ads (115,883 clicks to page from these ads). While we saw higher impressions for the banner ads in January, we changed bidding strategies to ensure we are reaching an engaged audience – which by evidence of clicks, we are.
- The FeedYourImmuneSystem.com landing page received more than 150k pageviews in February – a 156% increase from January and 400% increase from ALL of Q1 2021 (1346% compared to February 2021).
- March: Feed Your Immune System – The Q1 campaign wrapped up in March with results that outpaced 2021’s award-winning campaign. Most notably:
- The FeedYourImmuneSystem.com landing page received more than 10x the pageviews compared to 2021.
- The Banner Ads (new in 2022) were instrumental in getting eyes and traffic to the landing page – contributing to more than 240,000 clicks to site and 61% of all Social/Digital Impressions in 2022.
- The drop in impressions throughout the quarter was due to bidding strategies changing to target more audiences that would click.
- April: Earth Month – Mushroom Council kicked off Earth Month with the “Mushrooms – The Official Ingredient of Earth Month” campaign, which resulted in our most successful campaign to date this year (measured by impressions and engagements).
- The vast majority of impressions (90%) were the result of our Earth Month partnerships: Kittch (4.2M), Social Influencers (9.5M) and Produce for Better Health (1.6M).
- During April, we increased consumer elbasts to weekly, resulting in a 300% increase in opens and clicks.
- Website impressions (pageviews) saw a decrease due to the majority of MC promotions pointing users to the Mushroom Council Kittch channel to watch the daily streams (vs. pointing to our own site).
- Instagram Reels sharing chef stream “cut downs” (created in partnership with Kittch) helped to increase Instagram impressions (+17%) and engagement (+37%).
- May: National Burger Month – Mushroom Council kicked off its Food Network promotions and Blended Burger Contest in May. While we are still waiting on reporting from Food Network for May activities, we did see some notable highlights:
- Facebook Impressions increased by nearly 90% due to the increase in paid support and promotions for the Blended Burger Contest.
- Pinterest Impressions doubled (+100%) from April due to increased burger pins and added spend.
- Website traffic increased (+44%) due to promotions pointing to the Blended Burger Contest page on MC.com, with the page itself accounting for 25% of all pageviews from May.
- The Enewsletter saw a dramatic decrease in Opens and Clicks. This is due to scaling back to our cadence of 1x/month communications. In April, we sent out weekly eblasts promoting our Kittch chefs, which dramatically increased Total Opens/Clicks.
Monthly Topline Report
Tracker Highlights – Period ending 07/10/2022
- Download Retail Tracker for Period ending 07/10/2022
- Download Fresh Mushroom Sales Review for Period ending 07/10/2022
- Download Mushroom Retail Performance for Period ending 07/10/2022
Inflation has dominated the trade and consumer headlines since early fall of last year and the four weeks ending July 10th were no different. According to the June edition of the IRI monthly survey of primary shoppers:
- The 40-year high inflation is creating a complex pattern of marketplace trends, including cooking from scratch one day and leaning on value-added solutions the next. Likewise, consumers are seamlessly switching between value and premium. The share of home-prepared meals continued to average around 79-80%, but is higher among low-income shoppers, at 81.7%, versus high-income shoppers, at 76.7%.
- Concern over inflation reached its most widespread level yet, at 93% of all grocery shoppers. Up from 50% in the fall, 81% of grocery shoppers made changes to what and where they purchased in June. Additionally, 95% of shoppers are concerned about the higher gas prices and 72% changed their driving habits because of it, from trying to stock up more to delaying road trips.
- Sales specials, while popular, are still far below pre-pandemic levels and consumers are taking notice: 59% say fewer of the items they want are on sale and 43% say items are not discounted as much as before.
- Restaurant engagement in June was virtually unchanged from spring levels: 55% of consumers got restaurant takeout in June and 52% dined on-premise. An additional 19% had restaurant food delivered.
- The level of new COVID-19 cases no longer appears to have a significant impact on whether people shop in-store or online. Less than one-quarter of Americans are extremely concerned about COVID-19 as of June. In-store trips are holding at a high 87% of total trips.
Dollars, Units and Volume Performance
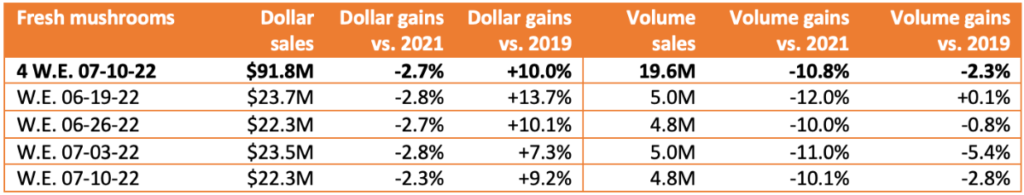
- The price per unit across all food and beverages increased 12.7% during the four weeks ending July 10th, 2022 versus the same four weeks in 2021 and +24.7% versus 2019. Dollar sales trended in the positive for most departments, boosted by high inflation, but units and volume remained suppressed. Produce department sales reached $6.2 billion during the four-week period, which was up 2.2% — a continued deceleration from prior months. Units were down -5.6% and volume sales (pounds) were down 4.9% year-on-year. During the four-week period, fresh mushroom dollars decreased 2.7% year-on-year. Volume declined by 10.8% — slightly less than the -11.5% in the prior four-week period. Year-to-date, dollars were down less than 5%.
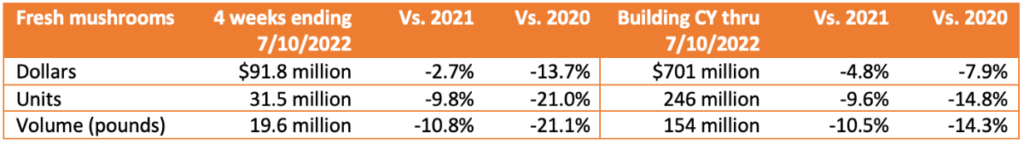
- Dollar sales during each of the individual weeks averaged $22-$24 million. In comparison to last year, dollars were 2.7% behind across the quad-week period. In pounds, the individual weeks hovered around 5 million pounds and the four-week period was down 10.8% versus year ago. Father’s Day week (June 19th) was the largest week of the four.
Inflation
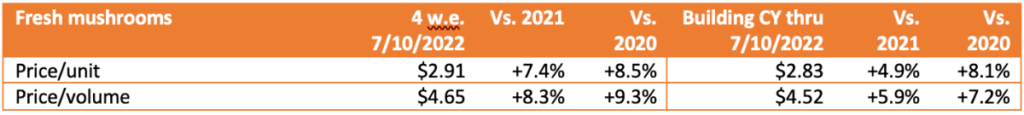
- The total produce performance was heavily impacted by inflation in the quad week and year-to-date views. Total produce prices increased to $2.64, up 9.2% during the four weeks ending June 12th on a per unit basis. Vegetables increased to an average of $2.22 per unit, up 10.2% versus year ago in the four-week period. The increases in the price per unit for mushrooms during this same time period remained below the total vegetable average, at +7.4%. At the same time, at $2.91, the average ring for mushrooms is higher than that of many other vegetable categories.
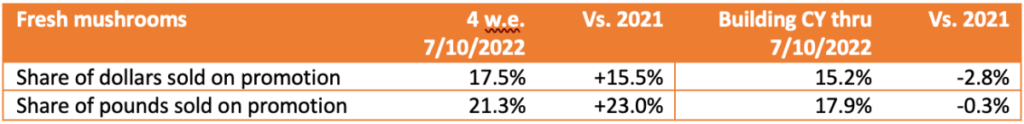
- Fresh mushroom dollar and pounds were promoted less often all year, but that changed this quad-week period. More than 21% of pounds were promoted, an increase of 23% versus the same four weeks year ago. Total vegetable promotions increased by 10.2% during the four-week period to 23.4% of dollars.
Performance by segment
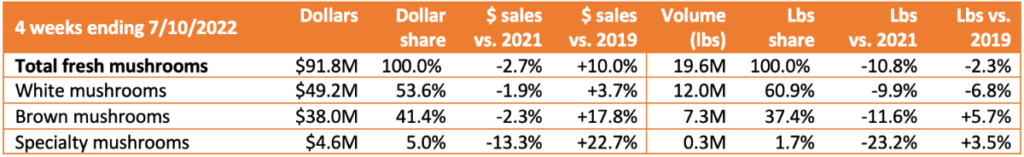
- White mushrooms represented 53.6% of total fresh mushroom dollars and 60.9% of pounds. Whites were down the least year-on-year. Brown mushrooms, the combination of criminis and portabellas, and specialty mushrooms still sold more pounds than in 2019, while whites drove the overall decline.
Additional observations:
- Fixed versus random weight performance: Fixed weight represented 94.9% of dollars and had the better dollar, unit and volume performance.
- Organic versus conventional: Organic mushrooms made up 12.9% of total fresh mushroom sales in the four weeks. Organic mushrooms dollars increased year-on-year (+2.6%), but units and pounds were down.
- Cut/prepared versus whole mushrooms: Cut or prepared mushrooms made up 53.1% of dollar sales in the four-week period. Mushrooms without preparation had the better performance, down -3.4% year-on-year.
- Package size: eight-ounce packages had the strongest performance in dollars, units and volume.
IRI, Integrated Fresh, MULO, 52 weeks ending 07/10/2022
We collect, use and process your data according to our Privacy Policy.