 Shipping Reports
Monthly Shipping and Marketing Report | September 2022
Council Update
Open Positions on the Council (2023-2025 term):
Background forms and other information has been sent to the Secretary of Agriculture for appointments.
- Region 1 (All states except CA & PA) – two open positions (3-year terms)
- Region 2 (PA) – one open position (3-year term)
- Region 4 (Imports) – one open position for a 1+ year term
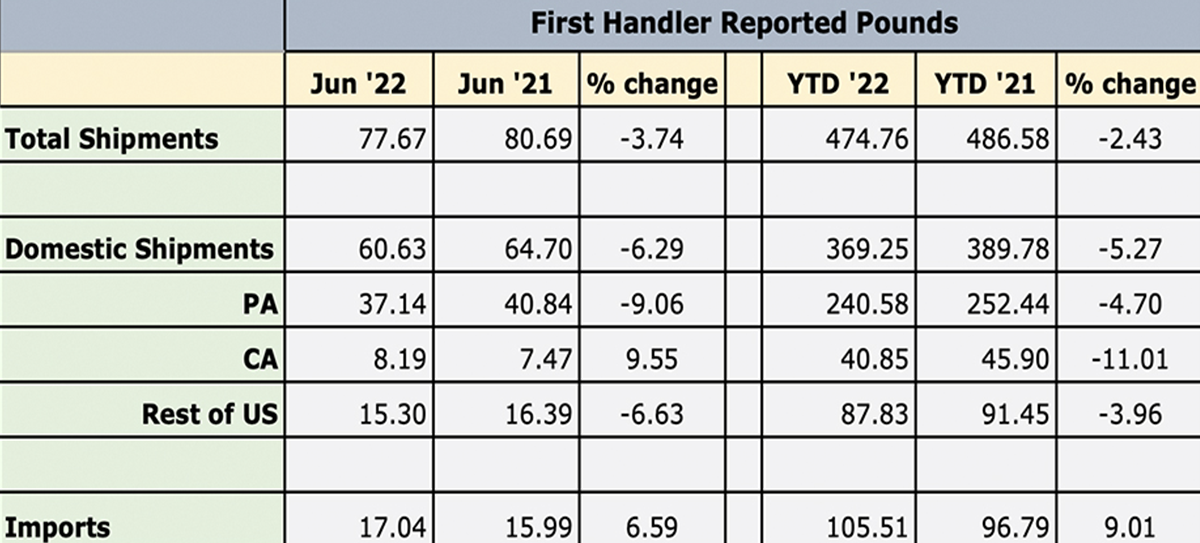
Shipment Summary
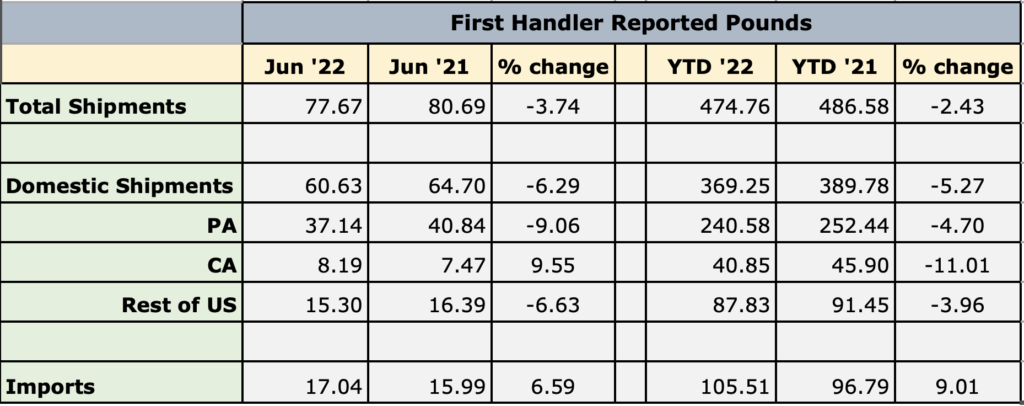
To see current charts, click here.
The Month Ahead
SCHOOL NUTRITION
- In September, Mushrooms in Schools will be discussing National Mushroom Month. We will be amplifying some of our current resources for school nutrition professionals through social media and newsletter. Additionally, we will be highlighting mushroom varieties and how to use them in school nutrition. We encourage other channels to amplify Mushrooms in Schools by sharing our posts on Facebook and Twitter.
Highlights from August
SCHOOL NUTRITION
- Mushrooms in Schools promoted resources through social media channels. We provided families with portabella burger recipes. Our Layers of Flavors Training was provided to school districts as a resource for back to school. Additionally, we amplified a school district’s recipe, Chef Salad Box.
Upcoming Events
SCHOOL NUTRITION
- Mushrooms in Schools is exhibiting at the 2022 Urban School Food Alliance Meeting in Baltimore, MD during September. If you are interested in more information contact Malissa Marsden to discuss your involvement.
Metrics
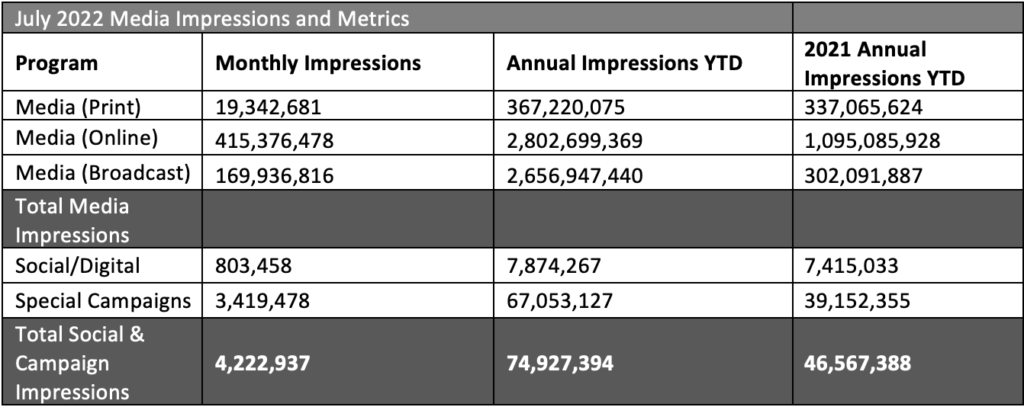
Notable Impressions Highlights:
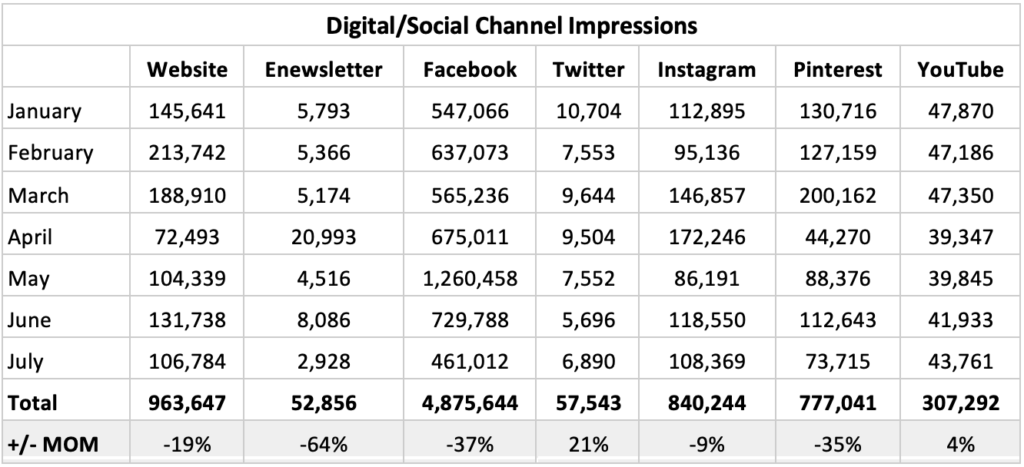
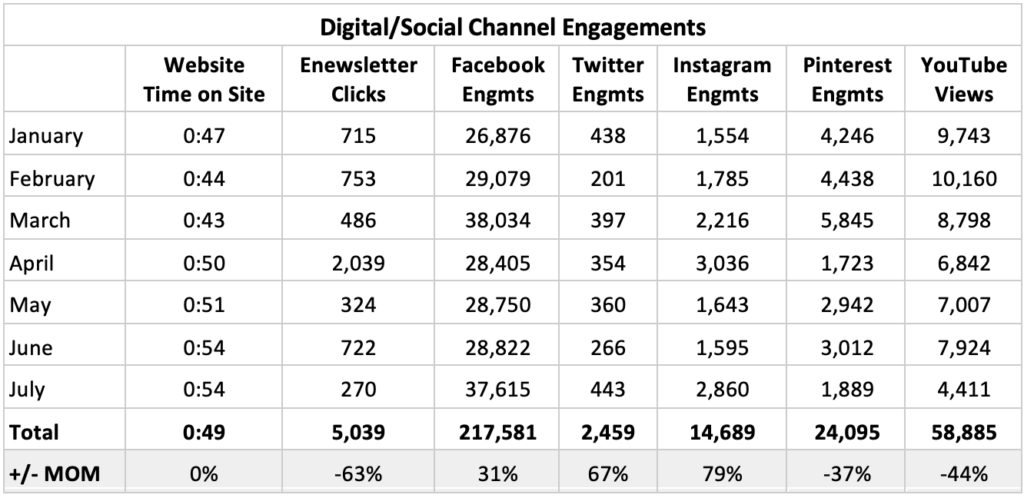
- July: The Food Network Blended Burger Contest ended in June. We kicked off the micro-campaign; value in response to inflation. The messaging for this campaign is centered around mushrooms are essentail, an answer to rising food costs. While this is a micro-campaign, we did see some notable highlights:Social Engagement (FB, Twitter, IG) saw a 69% increase from June. Posts about mushroom sustainability, meme/infographic-style posts, and a recipe share from The Kitchn generated the most engagements. July post copy was also shorter and used more emojis than June post copy.
- Website traffic decreased by 19%. We attest this drop due to traffic driving increases from Food Network the prior month.
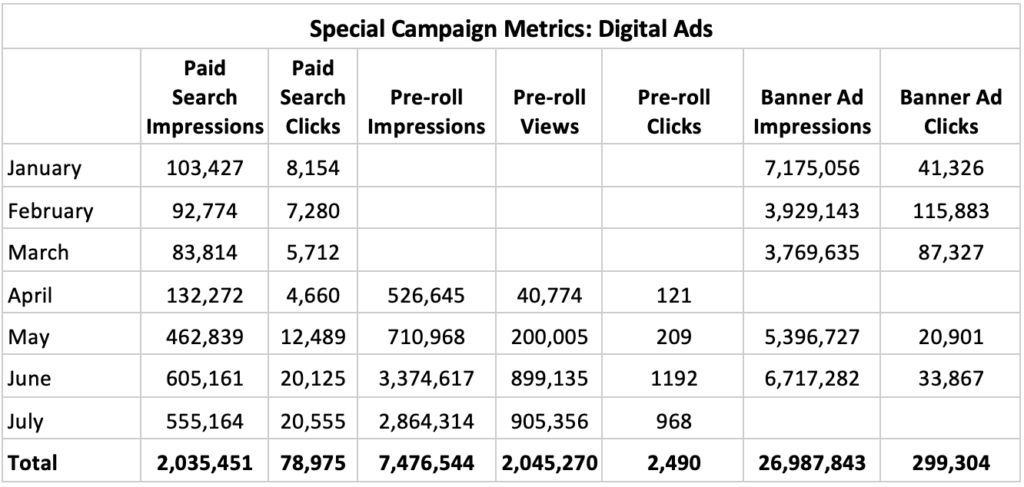
- Pre-roll Impressions and Views continues to perform well above our monthly average with 2,864,314 Impressions and 905,356 views. We ran 2 ads in July, blended and value content.
- E-newsletter metrics decreased; we sent 1 email in July, 2 emails in June.
Special Campaign Impressions
Includes paid promotions, partnerships and advertising activities.
Previous Months’ Highlights
- January: Feed Your Immune System – The revamped “Feed Your Immune System” campaign kicked off in January, leading to an increase in social impressions across nearly all channels.New digital banner ads in January contributed to 7M impressions – helping to surpass January 2021 impressions.
- Influencer impressions decreased from 2021 with a stronger focus on engagements (views, clicks) as video becomes a primary way to reach audiences with our messages.Noteably: Engagements nearly doubled and clicks to site more than tripled.
- Instagram Reels and new animations helped to increase Instagram impressions by nearly 200%, while the website also saw a dramatic increase in pageviews due to the campaign landing page traffic.
- The FeedYourImmuneSystem.com landing page received nearly 60k pageviews in January – a 411% increase from January 2021.
- February: Feed Your Immune System – February saw continued success for the FYIS campaign as numbers built and surpassed January metrics, especially on the website:
- The FeedYourImmuneSystem.com landing page received more than 150k pageviews in February – a 156% increase from January and 400% increase from ALL of Q1 2021 (1346% compared to February 2021).
- Avg. time on page stayed around 5 minute (4:59) – still surpassing the site average of 2-3 minutes.
- A majority of the traffic came from the FYIS banners ads (115,883 clicks to page from these ads). While we saw higher impressions for the banner ads in January, we changed bidding strategies to ensure we are reaching an engaged audience – which by evidence of clicks, we are.
- The FeedYourImmuneSystem.com landing page received more than 150k pageviews in February – a 156% increase from January and 400% increase from ALL of Q1 2021 (1346% compared to February 2021).
- March: Feed Your Immune System – The Q1 campaign wrapped up in March with results that outpaced 2021’s award-winning campaign. Most notably:
- The FeedYourImmuneSystem.com landing page received more than 10x the pageviews compared to 2021.
- The Banner Ads (new in 2022) were instrumental in getting eyes and traffic to the landing page – contributing to more than 240,000 clicks to site and 61% of all Social/Digital Impressions in 2022.
- The drop in impressions throughout the quarter was due to bidding strategies changing to target more audiences that would click.
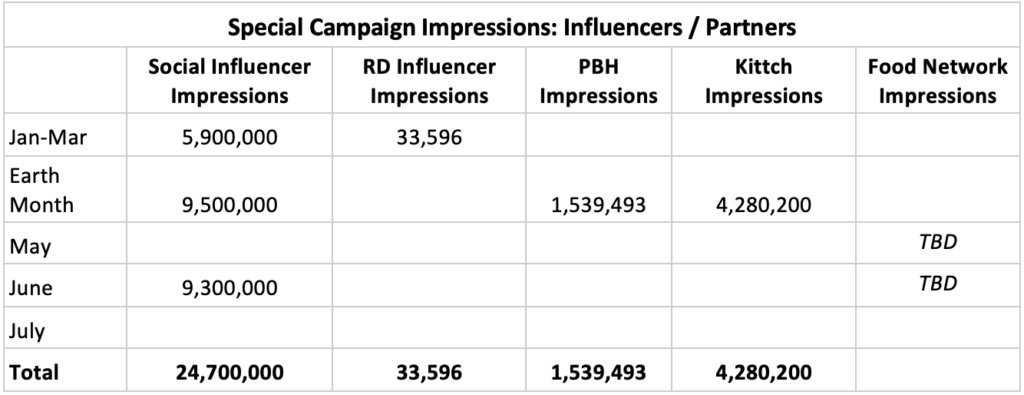
- April: Earth Month – Mushroom Council kicked off Earth Month with the “Mushrooms – The Official Ingredient of Earth Month” campaign, which resulted in our most successful campaign to date this year (measured by impressions and engagements).
- The vast majority of impressions (90%) were the result of our Earth Month partnerships: Kittch (4.2M), Social Influencers (9.5M) and Produce for Better Health (1.6M).
- During April, we increased consumer elbasts to weekly, resulting in a 300% increase in opens and clicks.
- Website impressions (pageviews) saw a decrease due to the majority of MC promotions pointing users to the Mushroom Council Kittch channel to watch the daily streams (vs. pointing to our own site).
- Instagram Reels sharing chef stream “cut downs” (created in partnership with Kittch) helped to increase Instagram impressions (+17%) and engagement (+37%).
- May: National Burger Month – Mushroom Council kicked off its Food Network promotions and Blended Burger Contest in May. While we are still waiting on reporting from Food Network for May activities, we did see some notable highlights:
- Facebook Impressions increased by nearly 90% due to the increase in paid support and promotions for the Blended Burger Contest.
- Pinterest Impressions doubled (+100%) from April due to increased burger pins and added spend.
- Website traffic increased (+44%) due to promotions pointing to the Blended Burger Contest page on MC.com, with the page itself accounting for 25% of all pageviews from May.
- The Enewsletter saw a dramatic decrease in Opens and Clicks. This is due to scaling back to our cadence of 1x/month communications. In April, we sent out weekly eblasts promoting our Kittch chefs, which dramatically increased Total Opens/Clicks.
- June: The Food Network Blended Burger Contest kicked off in May and ran until June 27th. While we are still waiting on reporting from Food Network for May & June activities, we did see some notable highlights:
- Digital Campaign Impressions and Engagement saw a 63% increase from May. We attest this to grilling season, the Blended Burger Contest, and our Clever Influencer partnership.
- Website traffic increased (+26%) from May due to promotions pointing to the Blended Burger Contest page on MC.com. Session duration also saw an increase (0:54), the longest duration YTD.
- The Enewsletter saw a dramatic increase in Opens and Clicks. This is due to our additional email, Blended Burger Contest – “One Week Left” Reminder.
Monthly Topline Report
Tracker Highlights – Period ending 08/07/2022
- Download Retail Tracker for Period ending 08/07/2022
- Download Fresh Mushroom Sales Review for Period ending 08/07/2022
- Download Mushroom Retail Performance for Period ending 08/07/2022
High inflation is continuing to challenge life’s puzzle to balance time/convenience, healthfulness and money. Inflation is having a profound impact on shopping and consumption patterns with prolonged unit and volume pressure across categories in center store, frozen and fresh. According to the July IRI survey:
- Virtually all, 96%, of consumers are concerned about food cost inflation and 93% are concerned about the higher gas prices. Budgetary restraints are real: 45% of American households describe their financial situation as being worse than a year ago; 43% are having some or a lot of difficultly affording needed groceries; and 34% feel their financial situation one year from now will look worse than it does today.
- Eight in 10 grocery shoppers made changes to what and where they purchased. The dominant changes are looking for sales specials (49%), skipping non-essentials (44%), finding coupons (31%) and buying more private or other low-cost brands (32%). Despite the high gas prices, 17% cherry pick specials across retailers and 15% now do some of their shopping at lower-cost retailers.
- The share of home-prepared meals dropped to its lowest point in several years, at a consumer-estimated 78.2% of all meals. Eighty percent of consumers ordered from or ate at restaurants in July. More than half, 54%, have ordered restaurant takeout and 49% have dined in. At the same time, three-quarters of consumers make strategic choices to save when ordering restaurant-prepared food.
- Online shopping jumped up in July to 19% of trips, fueled by shopping convenience and as way to control the total basket spend.
Dollars, Units and Volume Performance
While the July Consumer Price Index generated by the Bureau of Labor Statistics moderated some month-over-month, this was predominantly driven by price declines in gasoline and airline tickets. Grocery prices increased further. Per IRI data, total food and beverages increased 13.7% for the four weeks ending August 7th 2022 versus the comparable weeks in 2021. Prices increased 26.2% versus the same four weeks in 2019. Produce inflation was slightly lower, at an average of 10.3% year-on-year. Fresh produce sales reached $6.0 billion during the four-week period, which was up 5.4% versus last year. However, gains were inflation-driven with units down 4.4% and volume down 4.7% year-on-year. Additionally, pound sales were flat (-0.1%) against 2019.
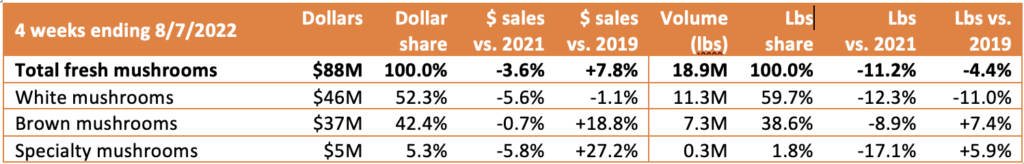
For the four weeks ending August 7th, 2022, fresh mushroom dollars decreased 3.6% year-over year and volume declined by 11.2%. When compared with the pre-pandemic normal of 2019, dollars were 7.8% higher while volume was down 4.4%.
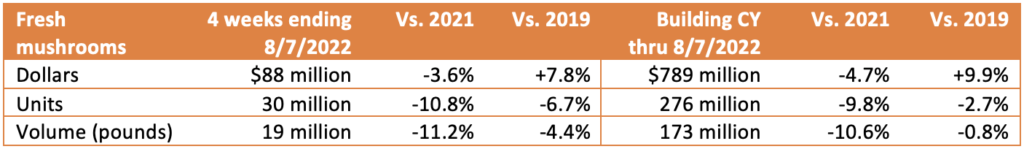
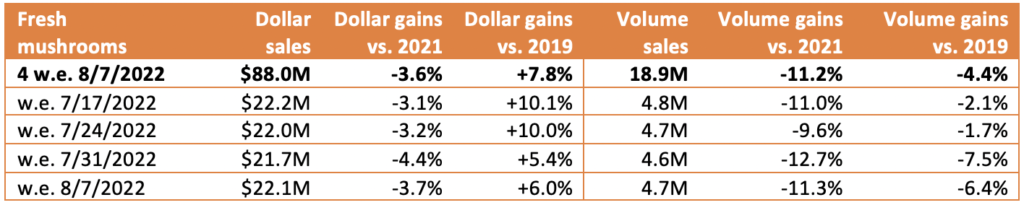
- Weekly sales for mushrooms averaged between $21.7 and $22.2 million and pounds ranged from 4.6 million to 4.8 million. Traditionally, the August 7th quad-week period has represented the lowest share of annual volume. With the assumption that prior-year sales patterns would hold, pounds were expected to be down from the prior quad-week period but are likely to increase in the remaining time periods of 2022 (see forecast tab).
Inflation
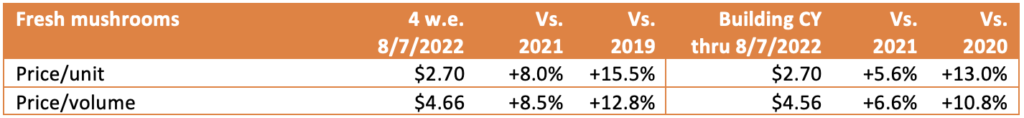
- The total produce performance was heavily impacted by inflation in the quad week and year-to-date views. Total The total produce performance remained heavily impacted by inflation. Year-on-year, total produce prices increased 10.3% during the four weeks ending August 7th on a per unit basis and 10.6% on a per pound basis. The average unit price for vegetables jumped to $2.05, up 9.7%. The increase in the price per unit for mushrooms remained below average, at +8.0%.
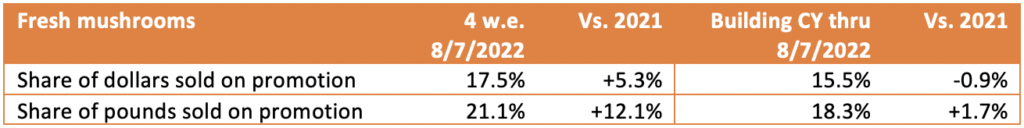
- Following two years of little promotional activity, 12.1% more fresh mushroom pounds were sold on promotion in the latest quad weeks versus year ago. This brought the share of pounds sold on promotion to 21.1%.
Performance by segment
- White mushrooms represented 52.3% of total fresh mushroom sales and 59.7% of pounds in the four-week period. However, it was brown mushrooms, the combination of criminis and portabellas, that fared better with 7.4% pound growth over the 2019 levels, whereas white mushrooms were down 11%.
Additional observations:
- Packaged vs. bulk: Pre-packaged represented 95.5% of pounds and outperformed bulk in dollars/pounds.
- Organic vs. conventional: Organic mushrooms made up 10.8% of pounds and 13.8% of dollars. Organic far outperformed conventional in dollars, units and volume.
- Cut/prepared versus whole mushrooms: Cut or prepared mushrooms made up 53.6% of dollar sales in the four-week period. Mushrooms without preparation had the better performance.
IRI, Integrated Fresh, MULO, YTD and 4 weeks ending 08/07/2022
We collect, use and process your data according to our Privacy Policy.