 Shipping Reports
Monthly Shipping and Marketing Report | September 2023
Council Update
Council Meeting: The next Council meeting will be held on February 27 in Las Vegas prior to the North American Mushroom Conference. If you are interested in attending, please let us know so we can be sure you are accommodated.
Council Webinars: See past webinars here: MushroomCouncil Industry Member Webinars
Recently Approved Materials
National Mushroom Month: Real Food. Real Fast.
- Downloadable meal plans
- Recipe videos
- Social media graphics
- Banner Ads
- Blog post and press release
Mushroom Grilling 101 with Derek Sarno
- Recipe videos
- Social media videos
Allrecipes Holiday Ads
Mushrooms in the News:
Mushrooms In Schools
Mushroom Nutrition
Industry eBlasts
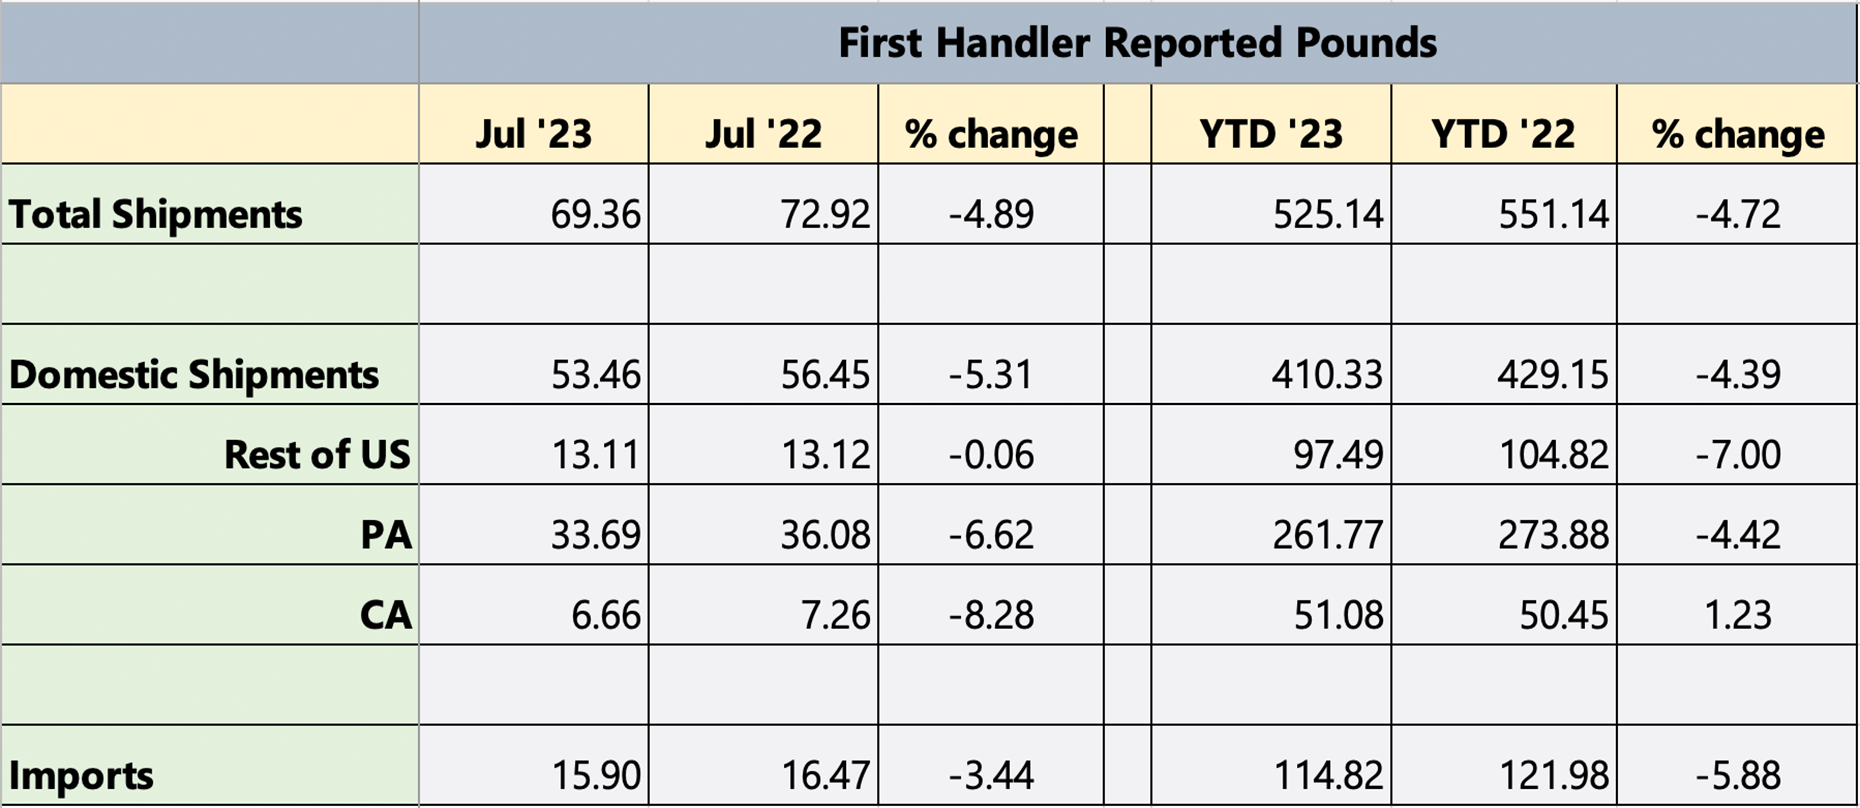
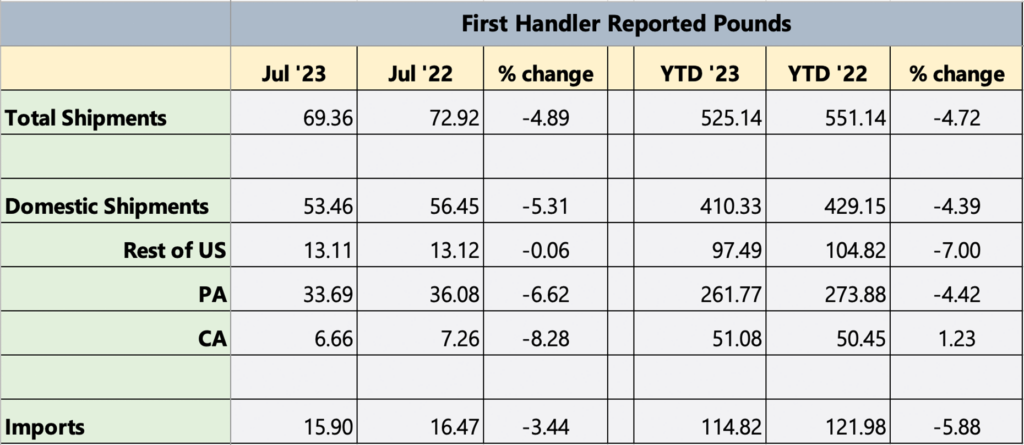
Shipment Summary
Channel Highlights
CONSUMER
September:
- Launch of Mushroom Month campaign, featuring 4 weeks of meal plans for busy families. All recipes are 10 ingredients or less and can be completed in 15-30 minutes. Get a sneak peek of the landing page a find some new easy recipes!
August:
- Celebrity chef Derek Sarno showcased new ways to enjoy browns and buttons on the grill in advance of Labor Day. Share this fun video with a mushroom lover.
RETAIL
September:
- Anne-Marie Roerink, our market insights expert, is developing a mushroom engagement report to provide insight into changes in fresh mushroom household penetration, retail trips and grocery spending for Q2 of 2023.
MUSHROOMS IN SCHOOLS
September:
- In September, Mushrooms in Schools will be celebrating Mushroom Month! This will be timely as schools will begin to plan for Farm to School month in September. Additionally, we plan to use Mushroom Month to reach more of our audience, such as CACFP and families. We will highlight resources and recipes all month long. Our giveaways for schools and CACFP will occur to increase engagement from these stakeholders, as well as to gather wonderful mushroom recipes. We encourage other channels to amplify Mushrooms in Schools by sharing posts on Facebook and Twitter.
August:
- During August, Mushrooms in Schools promoted school breakfast recipes and provided tips for engaging students during breakfast. We highlighted recipes, resources and school breakfast tips via our newsletter, blog, and social media platforms. On our social media platforms, we highlighted the following school districts: Franklin Community Schools Food Service and HUSD Child Nutrition.
FOODSERVICE
August:
- The Mushroom Council’s Chef Partners, Pam Smith and Andrew Hunter led the Colleges & Universities Good Food Culinary Day at Yale University. They engaged the Dining Directors from Harvard, Princeton, Cornell, Boston University, MIT, University of Maryland and other northeast C & U culinary professionals.
NUTRITION RESEARCH
September:
- “A randomized controlled trial to investigate the cognitive, mood and metabolic effects of acute oyster mushroom intervention in older adults” abstract will be presented Sept. 18-21 during the Food and Bioactive Conference in Prague.
August:
- “What’s in a mushroom” metabolomics peer-reviewed manuscript was published in FOODS. It has over 500 views to date.
Marketing Summary
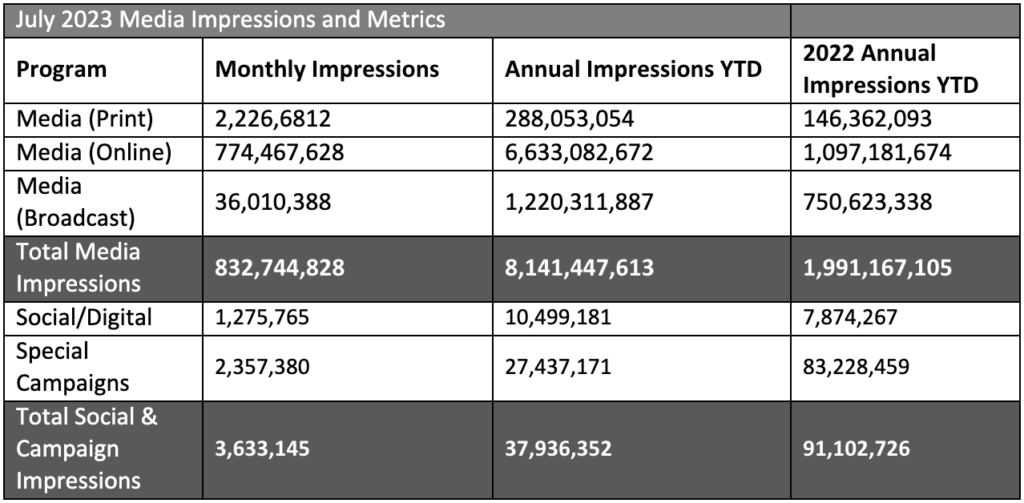
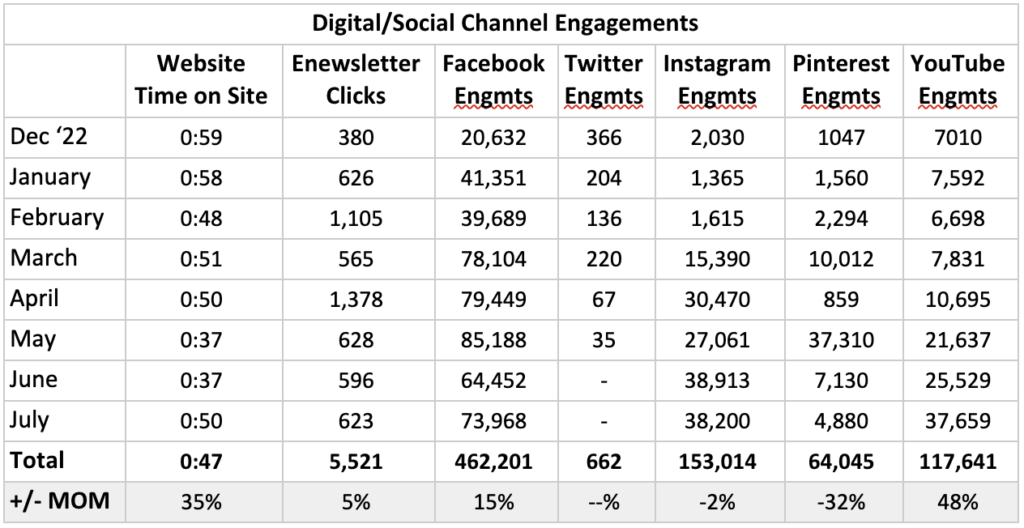
Notable Highlights for June
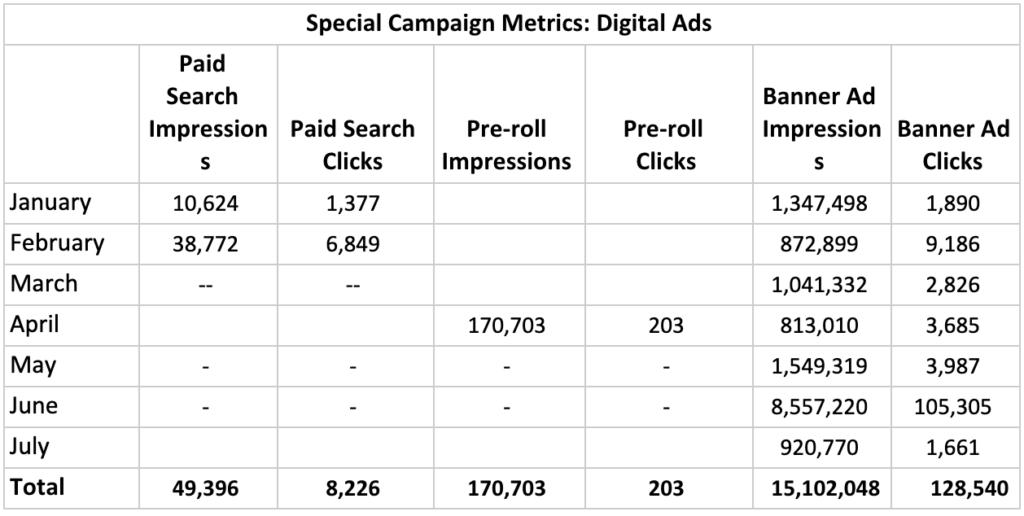
- The Allrecipes contest concluded mid-July, meaning ad spend for both digital ads and social ads also concluded, resulting in fewer impressions and engagements on some channels vs. June. Banner Ads continue to perform well as a driver of quality traffic to the website.
- CTR in July was .18%, besting the industry benchmark of 0.07%.
- Visitors have an engagement rate of 7.79%, which is a top performer and higher than organic search, showing that audiences find the ads relevant and are willing to continue their customer journey on the website.
- Facebook engagements were up by 200+% and Impressions by 50+% vs. compared to July 2022.
- Most engagements came from the static posts rather than the videos.
- Simple flavor call outs like the mushroom and herbs post did extremely well with over 2.8k likes.
- The timely Barbie themed post also did very well on both Facebook and Instagram, garnering thousands of engagements and hundreds of shares in a matter of hours.
- Paid engagements are up 171% on Instagram from last year with about the same amount of paid spend behind posts.
- In contrast to Facebook, videos outperformed static posts on Instagram, with July videos (Reels) performing incredibly well and garnering thousands of views per video.
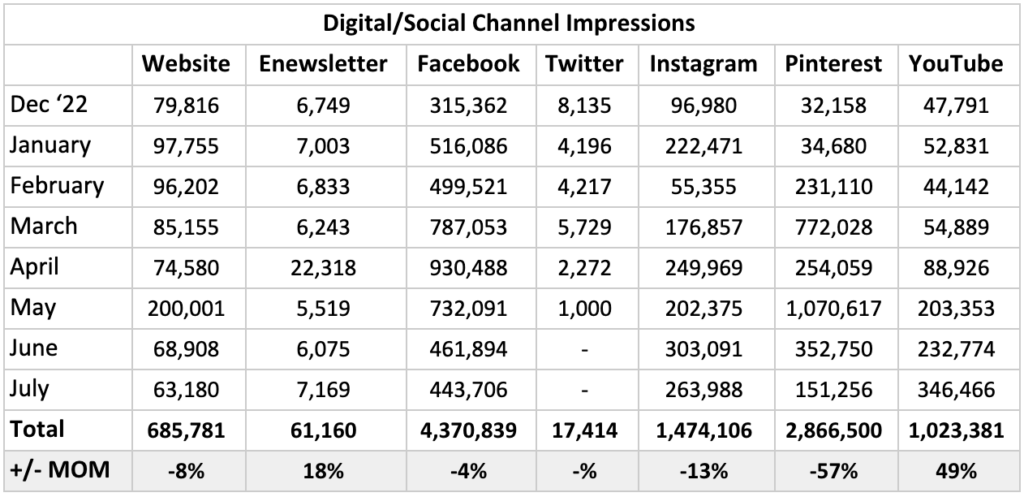
| *Youtube engagement metrics have changed. Digital metrics are constantly evolving, so we created our own updated Engagement metrics (comments + shares + likes + dislikes + subscribers lost + subscribers gained) |
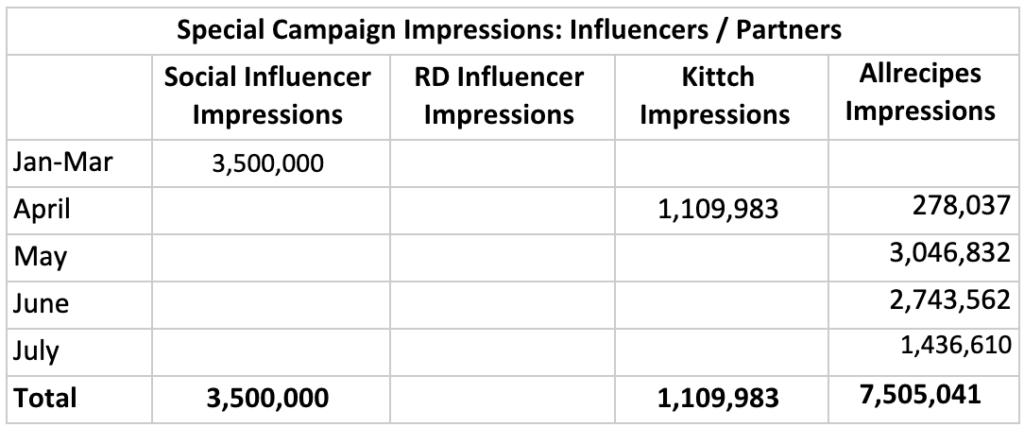
Special Campaign Impressions
Includes paid promotions, partnerships and advertising activities.
Previous Month’s Highlights
January
- The relaunch of this year’s FYIS campaign resulted in an influx of impressions and engagements across social channels, in particular Facebook (+64% increase in Impressions and 100% increase in Engagements).
- The FYIS kick-off eblast also prompted hundreds more clicks than the month prior, driving users to the FYIS landing page.
- While social impressions and engagements are tracking YOY, digital ad impressions are down compared to January 2022. This could be due to a lower ad budget this year, ad fatigue (3rd year running) and/or audience targeting changes. We are testing and evaluating ad updates to optimize and maximize our impact through the rest of the campaign.
February
- Overall impressions from the MC social channels dipped compared to last month but remain consistent with results YOY.
- We shifted budget from Instagram and Facebook to Pinterest, which is reflected in the dramatic increase in engagements and impressions.
- Due to the inclusion of the “Feed Your Immune System with Soup” giveaway in the e-newsletter, we saw a 77% increase in clicks. 28% of the total clicks were to the Facebook post, followed by the FYIS Exclusive Recipe Card Download.
- Pinterest impressions and engagements also saw an incredible spike due to reallocation of paid spend on this channel.
- Digital ad results are up from January, but continue to underperform compared to 2021 due to an increase in cost per impression and competition. We’re continuing to test and evaluate updates to help optimize throughout the rest of the campaign – and future campaigns.
March
- While overall Impressions and Engagements remain steady/positive for for MC social channels, we are continuing to see numbers down from last year’s digital ads, which were a huge contributor to Impressions and Clicks to the website. Despite shifts in budget, targeting and creative, we were unable to meet the same impressions we saw last year.
- This is likely contributed to increasing competition: The PPC (Pay Per Click) advertising landscape has become increasingly competitive as more businesses continue to shift/invest in digital ads.
- As we move into new campaigns, we’ll continue to test and optimize digital ads to better understand whether to continue or shift budgets to better performing tactics.
- Despite the decline in digital ads YOY, we are seeing tremendous performance on owned social platforms, specifically Pinterest and Instagram Impressions and Engagements, due to paid spend allocations.
April:
- Although we had a decrease in ad spend on Instagram from last year, we saw an increase of engagements on our posts. One large driver of engagements in April was the post asking users to pick their favorite recipe. This led to 77 comments, 28 shares, 126 saves and 388 likes which were primarily organic.
- On Pinterest our traffic to our website is up significantly from last year. We are going to continue to push this platform and look for ways to optimize our creative and copy to perform even better.
- With the increase to weekly eblast this month, we saw a dramatic increase in enewsletter opens and clicks.
- To note, we are shifting efforts away from Twitter with plans to monitor for questions only in the future. Expect to see drops in results on that channel as a result.
- We ran three different digital ad strategies this month targeting Home Chefs for Earth Month:
- Prospecting: Display (banner ads pointing to MC Earth Month landing page)
- Prospecting: Kittch (banner ads pointing to Kittch streams)
- Prospecting: Pre-Roll (pre-roll ad pointing to Kittch streams)
- Despite lower impressions from last year, the CTR on our digital ads is outstanding, besting the industry benchmark of 0.07%. TheCTR for MC digital ads for this month was .4%, an increase of 35% compared to the previous month.
- Pre-Roll performed great from a brand awareness standpoint, as 87,875 users watched the video in full.
May:
- Programmatic ads continue to perform well as a driver of quality traffic to the website.
- CTR continues to be outstanding for this channel at .84%, besting the industry benchmark of 0.07%.
- Website traffic increased considerably from last month, +168%.
- Facebook Paid Impressions are up and Organic impressions are down. This also shows us how important paid is in social, as year over year we see less organic engagement on posts.
- With incredible organic success on Pinterest, we are putting more efforts there, both organic and paid, hence the 321% increase in impressions and 4000%+ in engagements.
- Special Campaign and Overall Impressions are down from 2022, for several reasons, including a shift away from influencer partners, a shift from Food Network to Allrecipes (different campaigns and tracking), and the competitive digital ad landscape.
- To note, we are shifting efforts away from Twitter with plans to monitor for questions only in the future. Expect to see drops in results on that channel as a result.
June:
- Programmatic continues to perform well as a driver of quality traffic to the website. CTR (0.18%) continues to be outstanding for this channel, besting the industry benchmark of 0.07%.
- Visitors who have come to the Mushroom Council landing pages from our ads had an engagement rate of 8.2%, which is a top performer.
- We had 4.97 events per session from users who came to the website from our programmatic ads, which is higher than organic search. This shows that our audiences are finding the ads engaging, and willing to continue their customer journey.
- We did not have as many ads driving traffic in June as we have in previous months, so we did see a dip in traffic to the website in June.
- Spend was down this June on Instagram in comparison to last June, but our engagements were up 350%. We continue to see high performing static posts in June.
- We continued to run the “Add to Cart” ad campaign on Pinterest throughout the first half of June. Our pin click through rate was good at 1.29%, but the click through to the website was only 0.35% (total 577 people to the site).
Topline Report
Tracker Highlights – Period ending 08/13/2023
- Download Retail Tracker for Period ending 08/13/2023
- Download Fresh Mushroom Sales Review for Period ending 08/13/2023
- Download Mushroom Retail Performance for Period ending 08/13/2023
The Markeplace
Circana’s (formerly IRI) July sales numbers show little to no uptick in unit and volume sales despite it being the fourth consecutive month in which the rate of inflation cooled into the single digits. Only one department did manage to grow pounds year-on-year, and that was produce. July’s strength in fresh produce sales came from a very strong July Fourth holiday week in which pounds jumped 4.5% above year-ago levels on high demand and retailers investing in price.
- Home cooking is traditionally somewhat more subdued in the summer and grocery deli-prepared sales stepped up with big gains in entrees, salads, prepared meats, sandwiches, and above all, pizza. Deli-prepared pizza unit sales increased 8.9% in July and 10.6% over the latest 52 weeks. This includes pizza sold by the slice as well as fully-cooked and ready-to-cook pizzas — underscoring the opportunity to optimize mushroom’s presence on the deli-prepared side of the store.
- Consumers also enjoyed restaurant meals, with takeout (45% of consumers at least once) and delivery (16%) making up a larger share of meals than on-premise dining (49%).
- Although the rate of inflation has moderated, 89% of consumers still perceive grocery prices as being much (60%) or somewhat higher (29%) when compared to last year and 95% remain concerned over their ability to afford groceries. This has 53% of consumers chasing grocery specials, 46% cutting back on non-essentials and 31% switching to private brands, coupons or switching to lower-cost brands versus what they normally buy. Across categories, private brand sales are experiencing an above-average performance.
Dollars, Units and Volume Performance
After several months of inflation, retailers invested in price on the fruit side. Fresh vegetables did continue to have slight inflation, while fresh mushroom prices came down slightly, at -0.3%. Regardless, the fresh mushroom patterns followed that of the total store in the quad-week period, with unit and volume declines during the shorter and longer time periods. In the latest four weeks, volume declines stayed around 4 points of year ago levels. Importantly, volume declines are moderating in comparison with the 52-week look that shows pounds down 5.6%.

Weekly sales for mushrooms averaged between $21.3 million and $22.0 million in each of the four weeks. The period-over-period sales trends continue to follow long-established patterns(as seen on the forecasting tab). This quad-week period is traditionally the lowest sales period of the year on the retail side, after which volume gears up rapidly.

Inflation
Inflation across total food and beverages is slowing down and mushrooms are following suit. Mushroom prices per unit decreased by 0.4% versus year ago in the latest quad-week period. This is down from 4.8% in the 52-week view.

Moderation in price increases went hand-in-hand with an increase in promotional activity in the 52-week view. During the latest quad-week period 20.3% of total fresh mushroom dollars sold while on promotion, which was up 4.5%.

Performance by segment
White mushrooms represented 52.8% of mushroom dollars and 60.3% of pounds in the four-week period. Brown mushrooms, the combination of criminis and portabellas, had similar results. Specialty mushrooms, that include shiitake and oyster mushrooms, was the only area that increased dollar and pound sales.

Additional observations:
- Package size: 8-ounce packages generated 53.3% of total sales in the four-week period, but dollar sales declined 4.6% versus the same four weeks in 2022. 16-ounce packages represented 18.7% of sales and declined 6.8% in dollars.
- Organic vs. conventional: For total produce, organic sales are underperforming in comparison to conventional. Mushrooms are the opposite. Organic mushrooms made up 10.1% of pounds and have been an above-average performer for months. Over the past 52 weeks, dollar sales increased 1.2% for organic mushrooms versus a 5.0% decline for conventional. Organic also grew units and volume over the past four and 13 weeks.
IRI, Integrated Fresh, MULO, YTD and 4 or weeks ending 08/13/2023


We collect, use and process your data according to our Privacy Policy.