 Shipping Reports
Monthly Shipping and Marketing Report | December 2022
Council Update
A call for nominations will be sent out on February 1, 2023
- Region 1 (All states except CA & PA) – one open positions (3-year terms)
- Region 2 (PA) – one open position (3-year term)
- Region 4 (Imports) – one open position (3-year term)
Exemption Applications: The exemption applications for the 2023 calendar year will be mailed to those who are currently exempt. If you do not receive an application and would like to apply for an exemption, please email [email protected] or download an application here.
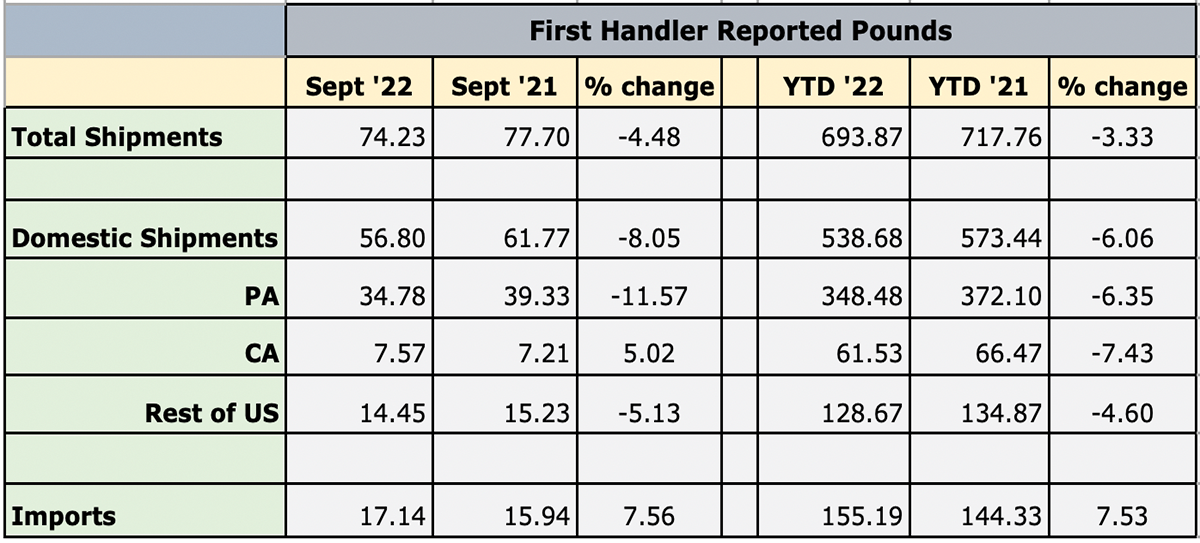
Shipment Summary

To see current charts, click here.
The Month Ahead
SCHOOL NUTRITION
- In December, Mushrooms in Schools will be celebrating 12 Days of Mushrooms! This is an exciting time of year when our audiences can interact with our social media and win free mushroom prizes. Additionally, we will be celebrating holiday meals and other resources families can use via our blog, social media, and newsletter. We encourage other channels to amplify Mushrooms in Schools by sharing our posts on Facebook and Twitter. For the month of December, we specifically ask for other channels to share our blog and social media (more to come throughout December) posts on 12 Days of Mushrooms.
Highlights from November
SCHOOL NUTRITION
- In November, Mushrooms in Schools discussed food safety for the holidays. Might Mushroom in the Kitchen was released with a new activity sheet for our CACFP audience. We amplified new resources on social media, blog, and newsletter. Additionally, we highlighted recipes and other resources school districts can use in kitchens. We provided our audience with recipes. We amplified Ukiah Unified School District Food Service for their beautiful salad bar and Everett Public Schools Food & Nutrition Services using our grow kits to teach students about mushrooms.
Metrics
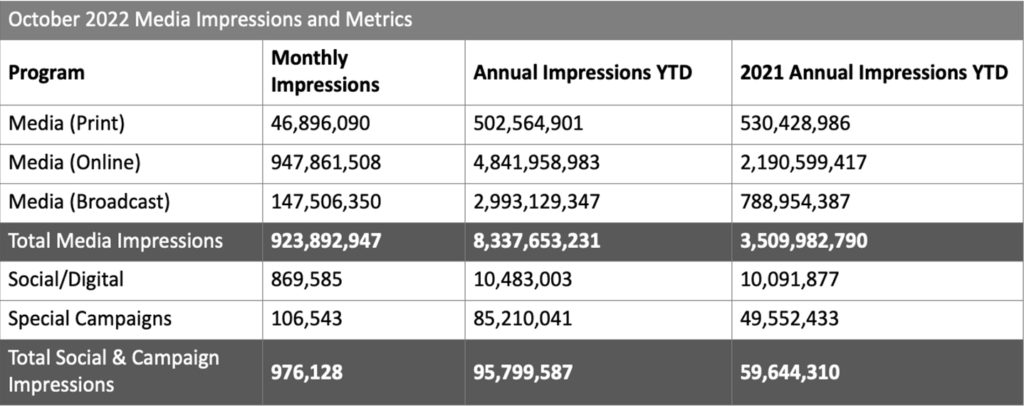
Notable Impressions Highlights:
- October
- Our syndicated article “A Savory Solution to Stretch Your Grocery Budget” continued to perform well, with over 100 placements and over 1.3 million impressions.
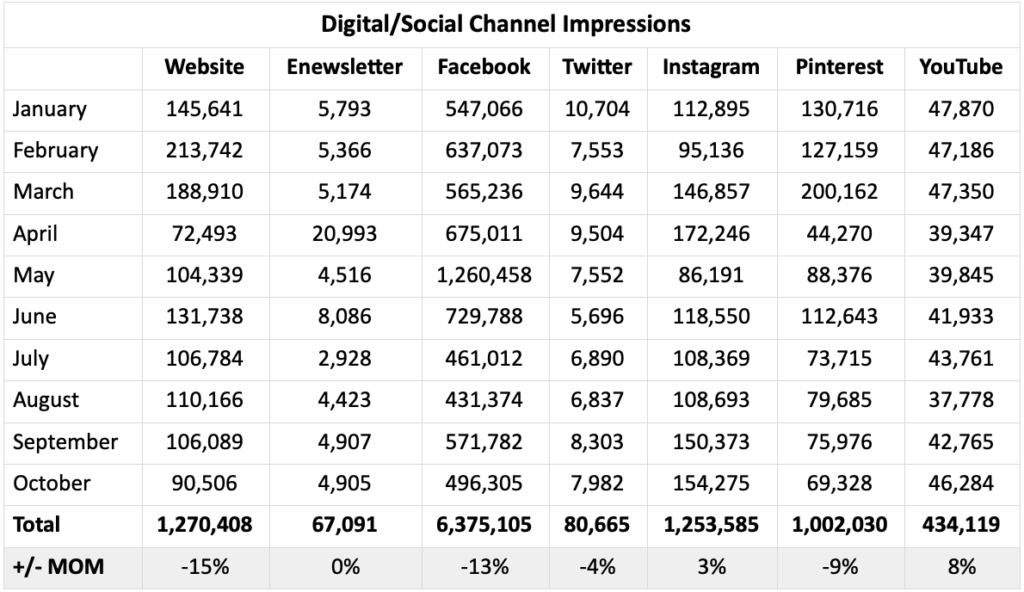
- We’ve seen a steady increase in duration on our consumer site since we’ve refreshed the website; reaching 59 seconds, the highest this year.
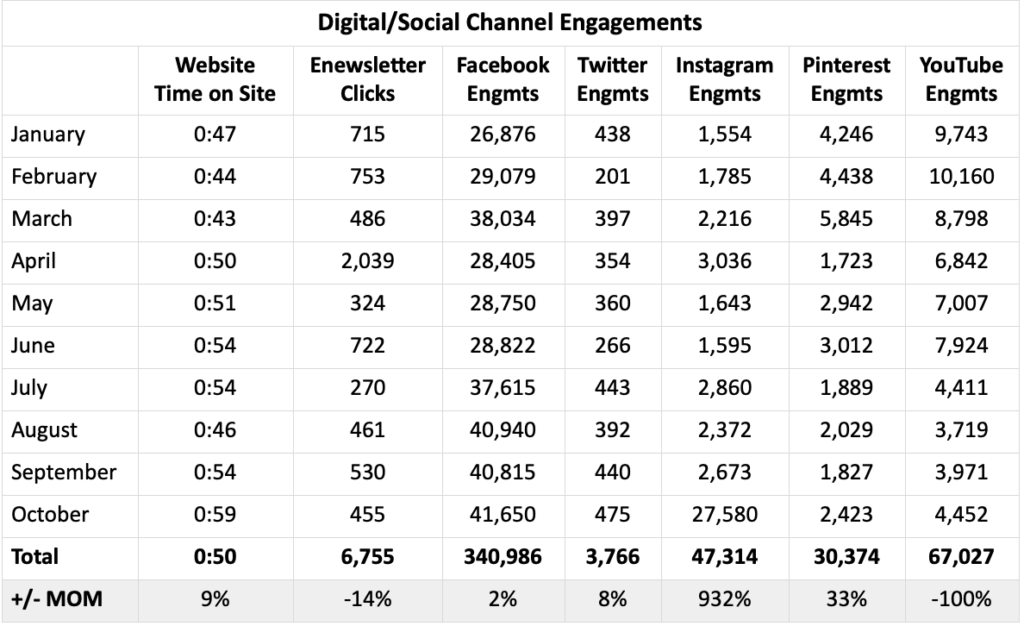
- You’ll notice a sizeable jump in Instagram engagement numbers as we combine organic and paid metrics moving forward.
- Social engagement metrics have increased likely due to our recipe content. Viewers ask questions and leave comments more often within our recipe posts.
- According to fourth quarter planning, ad spend and impressions taper down
| *Youtube Engagament metrics have changed. Digital metrics are constantly evolving, so we created our own updated Engagement metrics (comments + shares + likes + dislikes + subscribers lost + subscribers gained) |
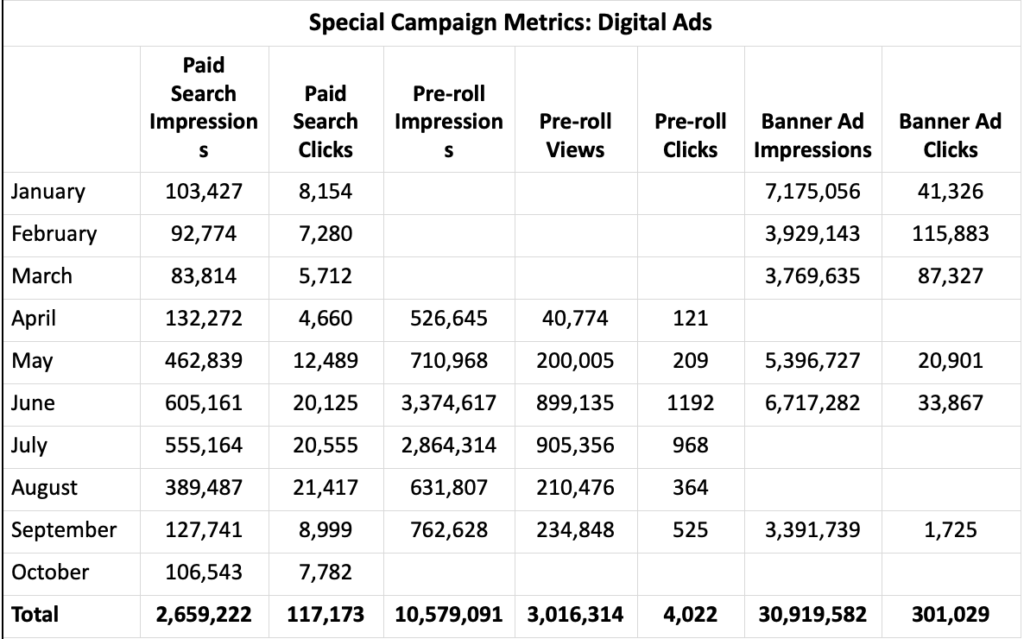
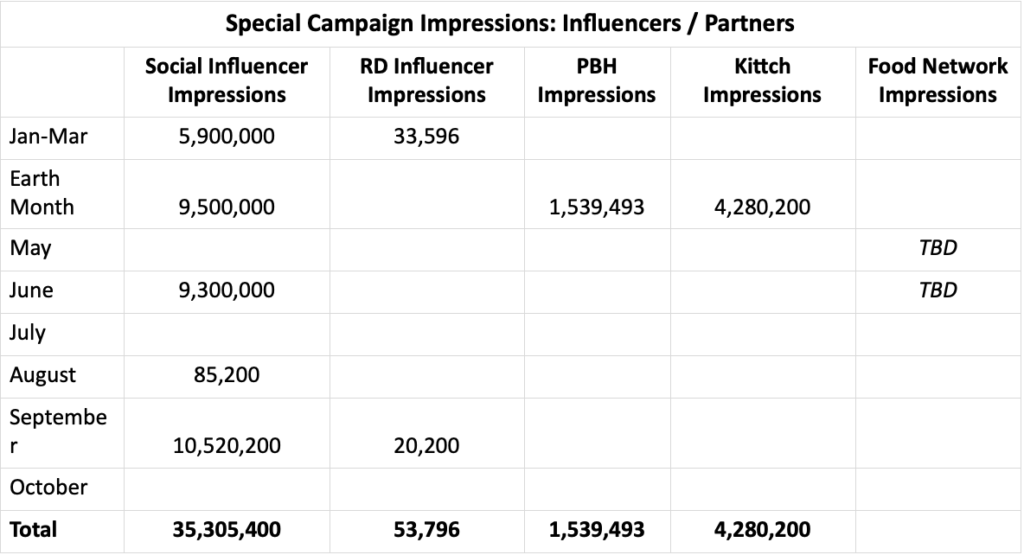
Special Campaign Impressions
Includes paid promotions, partnerships and advertising activities.
Previous Months’ Highlights
- January: Feed Your Immune System – The revamped “Feed Your Immune System” campaign kicked off in January, leading to an increase in social impressions across nearly all channels.New digital banner ads in January contributed to 7M impressions – helping to surpass January 2021 impressions.
- Influencer impressions decreased from 2021 with a stronger focus on engagements (views, clicks) as video becomes a primary way to reach audiences with our messages.Noteably: Engagements nearly doubled and clicks to site more than tripled.
- Instagram Reels and new animations helped to increase Instagram impressions by nearly 200%, while the website also saw a dramatic increase in pageviews due to the campaign landing page traffic.
- The FeedYourImmuneSystem.com landing page received nearly 60k pageviews in January – a 411% increase from January 2021.
- February: Feed Your Immune System – February saw continued success for the FYIS campaign as numbers built and surpassed January metrics, especially on the website:
- The FeedYourImmuneSystem.com landing page received more than 150k pageviews in February – a 156% increase from January and 400% increase from ALL of Q1 2021 (1346% compared to February 2021).
- Avg. time on page stayed around 5 minute (4:59) – still surpassing the site average of 2-3 minutes.
- A majority of the traffic came from the FYIS banners ads (115,883 clicks to page from these ads). While we saw higher impressions for the banner ads in January, we changed bidding strategies to ensure we are reaching an engaged audience – which by evidence of clicks, we are.
- The FeedYourImmuneSystem.com landing page received more than 150k pageviews in February – a 156% increase from January and 400% increase from ALL of Q1 2021 (1346% compared to February 2021).
- March: Feed Your Immune System – The Q1 campaign wrapped up in March with results that outpaced 2021’s award-winning campaign. Most notably:
- The FeedYourImmuneSystem.com landing page received more than 10x the pageviews compared to 2021.
- The Banner Ads (new in 2022) were instrumental in getting eyes and traffic to the landing page – contributing to more than 240,000 clicks to site and 61% of all Social/Digital Impressions in 2022.
- The drop in impressions throughout the quarter was due to bidding strategies changing to target more audiences that would click.
- April: Earth Month – Mushroom Council kicked off Earth Month with the “Mushrooms – The Official Ingredient of Earth Month” campaign, which resulted in our most successful campaign to date this year (measured by impressions and engagements).
- The vast majority of impressions (90%) were the result of our Earth Month partnerships: Kittch (4.2M), Social Influencers (9.5M) and Produce for Better Health (1.6M).
- During April, we increased consumer elbasts to weekly, resulting in a 300% increase in opens and clicks.
- Website impressions (pageviews) saw a decrease due to the majority of MC promotions pointing users to the Mushroom Council Kittch channel to watch the daily streams (vs. pointing to our own site).
- Instagram Reels sharing chef stream “cut downs” (created in partnership with Kittch) helped to increase Instagram impressions (+17%) and engagement (+37%).
- May: National Burger Month – Mushroom Council kicked off its Food Network promotions and Blended Burger Contest in May. While we are still waiting on reporting from Food Network for May activities, we did see some notable highlights:
- Facebook Impressions increased by nearly 90% due to the increase in paid support and promotions for the Blended Burger Contest.
- Pinterest Impressions doubled (+100%) from April due to increased burger pins and added spend.
- Website traffic increased (+44%) due to promotions pointing to the Blended Burger Contest page on MC.com, with the page itself accounting for 25% of all pageviews from May.
- The Enewsletter saw a dramatic decrease in Opens and Clicks. This is due to scaling back to our cadence of 1x/month communications. In April, we sent out weekly eblasts promoting our Kittch chefs, which dramatically increased Total Opens/Clicks.
- June: The Food Network Blended Burger Contest kicked off in May and ran until June 27th. While we are still waiting on reporting from Food Network for May & June activities, we did see some notable highlights:
- Digital Campaign Impressions and Engagement saw a 63% increase from May. We attest this to grilling season, the Blended Burger Contest, and our Clever Influencer partnership.
- Website traffic increased (+26%) from May due to promotions pointing to the Blended Burger Contest page on MC.com. Session duration also saw an increase (0:54), the longest duration YTD.
- The Enewsletter saw a dramatic increase in Opens and Clicks. This is due to our additional email, Blended Burger Contest – “One Week Left” Reminder.
- July: The Food Network Blended Burger Contest ended in June. We kicked off the micro-campaign; value in response to inflation. The messaging for this campaign is centered around mushrooms are essentail, an answer to rising food costs. While this is a micro-campaign, we did see some notable highlights:
- Social Engagement (FB, Twitter, IG) saw a 69% increase from June. Posts about mushroom sustainability, meme/infographic-style posts, and a recipe share from The Kitchn generated the most engagements. July post copy was also shorter and used more emojis than June post copy.
- Website traffic decreased by 19%. We attest this drop due to traffic driving increases from Food Network the prior month.
- Pre-roll Impressions and Views continues to perform well above our monthly average with 2,864,314 Impressions and 905,356 views. We ran 2 ads in July, blended and value content.
- E-newsletter metrics decreased; we sent 1 email in July, 2 emails in June.
- August: In anticipation of Mushroom Month, we released a syndicated article that quickly gained traction, resulting in approximately 12.6M impressions
- Our monthly Enewsletter saw a 51% increase in opens and 71% increase in clicks. We attest this to our catchy subject line “Mushrooms are the Answer” and engaging Value content within the email.
- Due to our Value campaign, website traffic increased (+3%) with a decrease (-15%) time on site. We expected to see a minor dip in numbers compared to the Blended Burger contest months.
- Although we saw a minor decrease in social impressions, we saw an increase in engagement for Twitter and Instagram. Recipe posts were top performing posts.
- September was National Mushroom Month:
- Our syndicated article “A Savory Solution to Stretch Your Grocery Budget” continued to perform well, with over 4,000 placements and over 13 million impressions.
- Due to National Mushroom Month, social channels (Facebook, Twitter, Instagram) saw a signifacant increase in impressions and engagement.
- Our site saw a 17% increase in time on site. We attest this to the launch of our National Mushroom Month landing page, featuring robust content on how Mushrooms are the Answer to… and a tote bag sweepstakes.
- We saw a drop in Pinterest engagement (-10%), our team has proactively worked with Pinterest to optimize the recipes with visibility to ingredient lists, timing, and servings now available.
Topline Report
Tracker Highlights – Period ending 11/06/2022
- Download Retail Tracker for Period ending 11/06/2022
- Download Fresh Mushroom Sales Review for Period ending 11/06/2022
- Download Mushroom Retail Performance for Period ending 11/06/2022
- Download IFPA Produce Sales Week 52
The Marketplace
Consumers estimate that they prepare more than 78% of meals at home, with elevated shares for lunch when compared to pre-pandemic.
- Leftovers, sandwiches and quick snacks rule the working-from-home lunch occasion, whereas restaurants rarely make it in the lineup.
- Concern about inflation remains high and 80% of Americans are shopping for groceries differently, including where and what they purchase. Sales specials and private brands are especially popular.
- Despite the high gas prices, 18% cherry pick specials across retailers, prompting a 2% increase in trips and a shift in channel shares.
- In total fresh, traditional grocery continues to have the largest share, at 33.2% of dollars in October 2022. However, this represents a 2.7 percentage points loss since 2019. Specialty/organic stores also lost share. The main beneficiaries of channel switching are mass/supercenter, club and online.
- Other top measures focus on cutting back on non-essentials and sticking to the budget — pressuring units and volume. Total food and beverage unit sales trailed last year by 3.8% in October 2022.
- In-person trips remain prevalent, at 85%, with the remainder equally divided between click-and-collect and delivery.
Dollars, Units and Volume Performance
The persistent high level of inflation is continuing the now familiar sales patterns for most departments around the store, including fresh produce: dollars up year-on-year, but units and volume down. However, the dollar gains for fresh produce were below that of total food and beverages as inflation is slowing down rapidly on the fruit side. Additionally, fresh fruit and vegetables lost share to frozen and canned as consumers emphasized price and shelf-life. Additionally, shoppers continued to shift to smaller pack sizes as evidenced by the difference in volume versus unit declines.
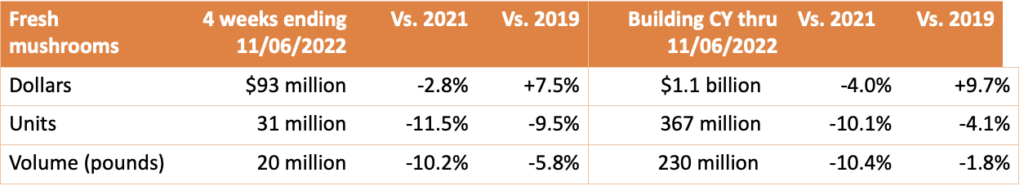
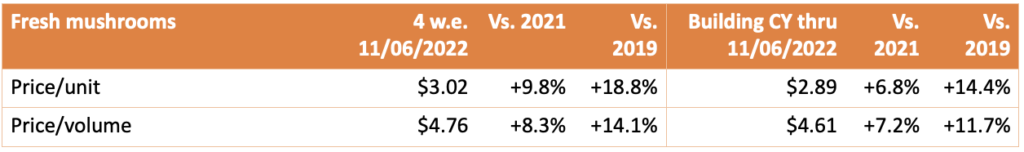
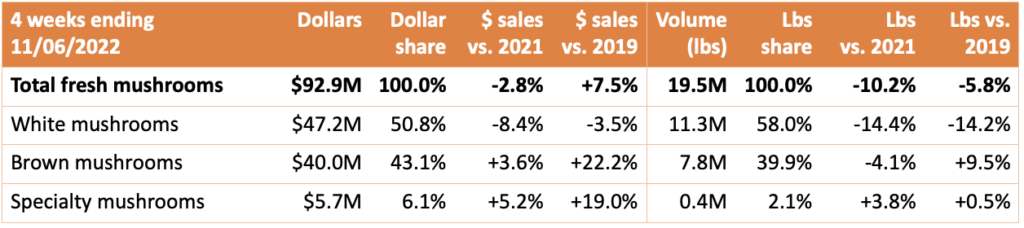
For the four weeks ending November 6th, 2022, fresh mushroom dollars decreased 2.8% year-over-year and volume declined by 10.2%. Year-to-date, dollars were down 4.0% versus year ago and pounds 10.4%. Dollars remained ahead of 2019 in both the shorter- and longer-term views, but pounds are now 1.8% behind those of 2019 in the year-to-date views and nearly 6% in the quad-week view versus pre-pandemic.
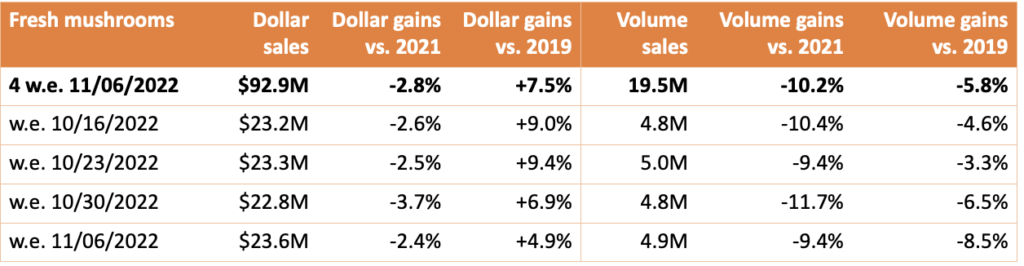
- Weekly sales for mushrooms averaged between $22.8 and $23.6 million, which was an improvement for each when compared to the prior quad week period. Total pounds increased slightly compared to the prior quad-week as well — following prior-year patterns that show an increase in mushroom sales from August through the end of the year (see forecast tab). However, they do remain behind year-ago levels.
Inflation
- Mushroom prices per unit increased by 9.8% versus year ago in the latest quad-week period. This means the rate of inflation jumped ahead of that for total fresh vegetables (+8.4%) and total fresh produce (+5.4%).
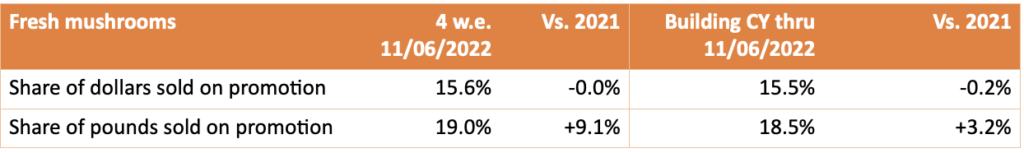
- Despite inflation, promotional activity remained low for fresh mushrooms, at 15.6% of total dollars and 19.0% of total pounds sold. Promotional levels for total fresh produce as well as total food and beverages are also up a bit year-on-year, but still below the 2019 pre-pandemic levels.
Performance by segment
- White mushrooms represented 50.8% of total fresh mushroom sales and 58.0% of pounds in the four-week period. However, it was brown mushrooms, the combination of criminis and portabellas, that fared better with 9.5% pound growth over the 2019 levels, whereas white mushrooms were down 14.2%.
Additional observations:
- Packaged vs. bulk: Pre-packaged represented 95.5% of pounds and outperformed bulk in dollars/pounds.
- Package size: Eight-ounce packages are, by far, the biggest seller and is outperforming 16 ounces in growth.
- Organic vs. conventional: Organic mushrooms made up 11.3% of pounds but far outperformed conventional mushrooms in performance in dollars, units and volume.
- Cut/prepared versus whole mushrooms: Cut or prepared mushrooms made up 48.8% of pound sales in the four-week period. Mushrooms without preparation had the better performance.
IRI, Integrated Fresh, MULO, YTD and 4 weeks ending 11/06/2022
We collect, use and process your data according to our Privacy Policy.